What you’ll need
- A Datadog account and API key.
- A project with ngrok deployed as an API gateway. If you don’t have one, you can use one of the following guides to get started:
Options for monitoring your API gateway and services
You can monitor API services in two ways in ngrok: with the Traffic Inspector and with Logs.- Traffic Inspector
- Logs
The Traffic Inspector is a filterable list of your API’s requests and responses, like structured logs in a human-readable format, available on the ngrok dashboard.
The Traffic Inspector is useful for viewing error details and for replaying requests to test new policies and bug fixes.
Observe API traffic with Traffic Inspector
In this section, you’ll learn the basics of the Traffic Inspector and work through an example that uses it for rate limiting.-
Browse to the ngrok Traffic Inspector on your ngrok account dashboard.
The list of recent requests provides you with basic information such as the time, origin, destination, duration, and response code of calls to your API.
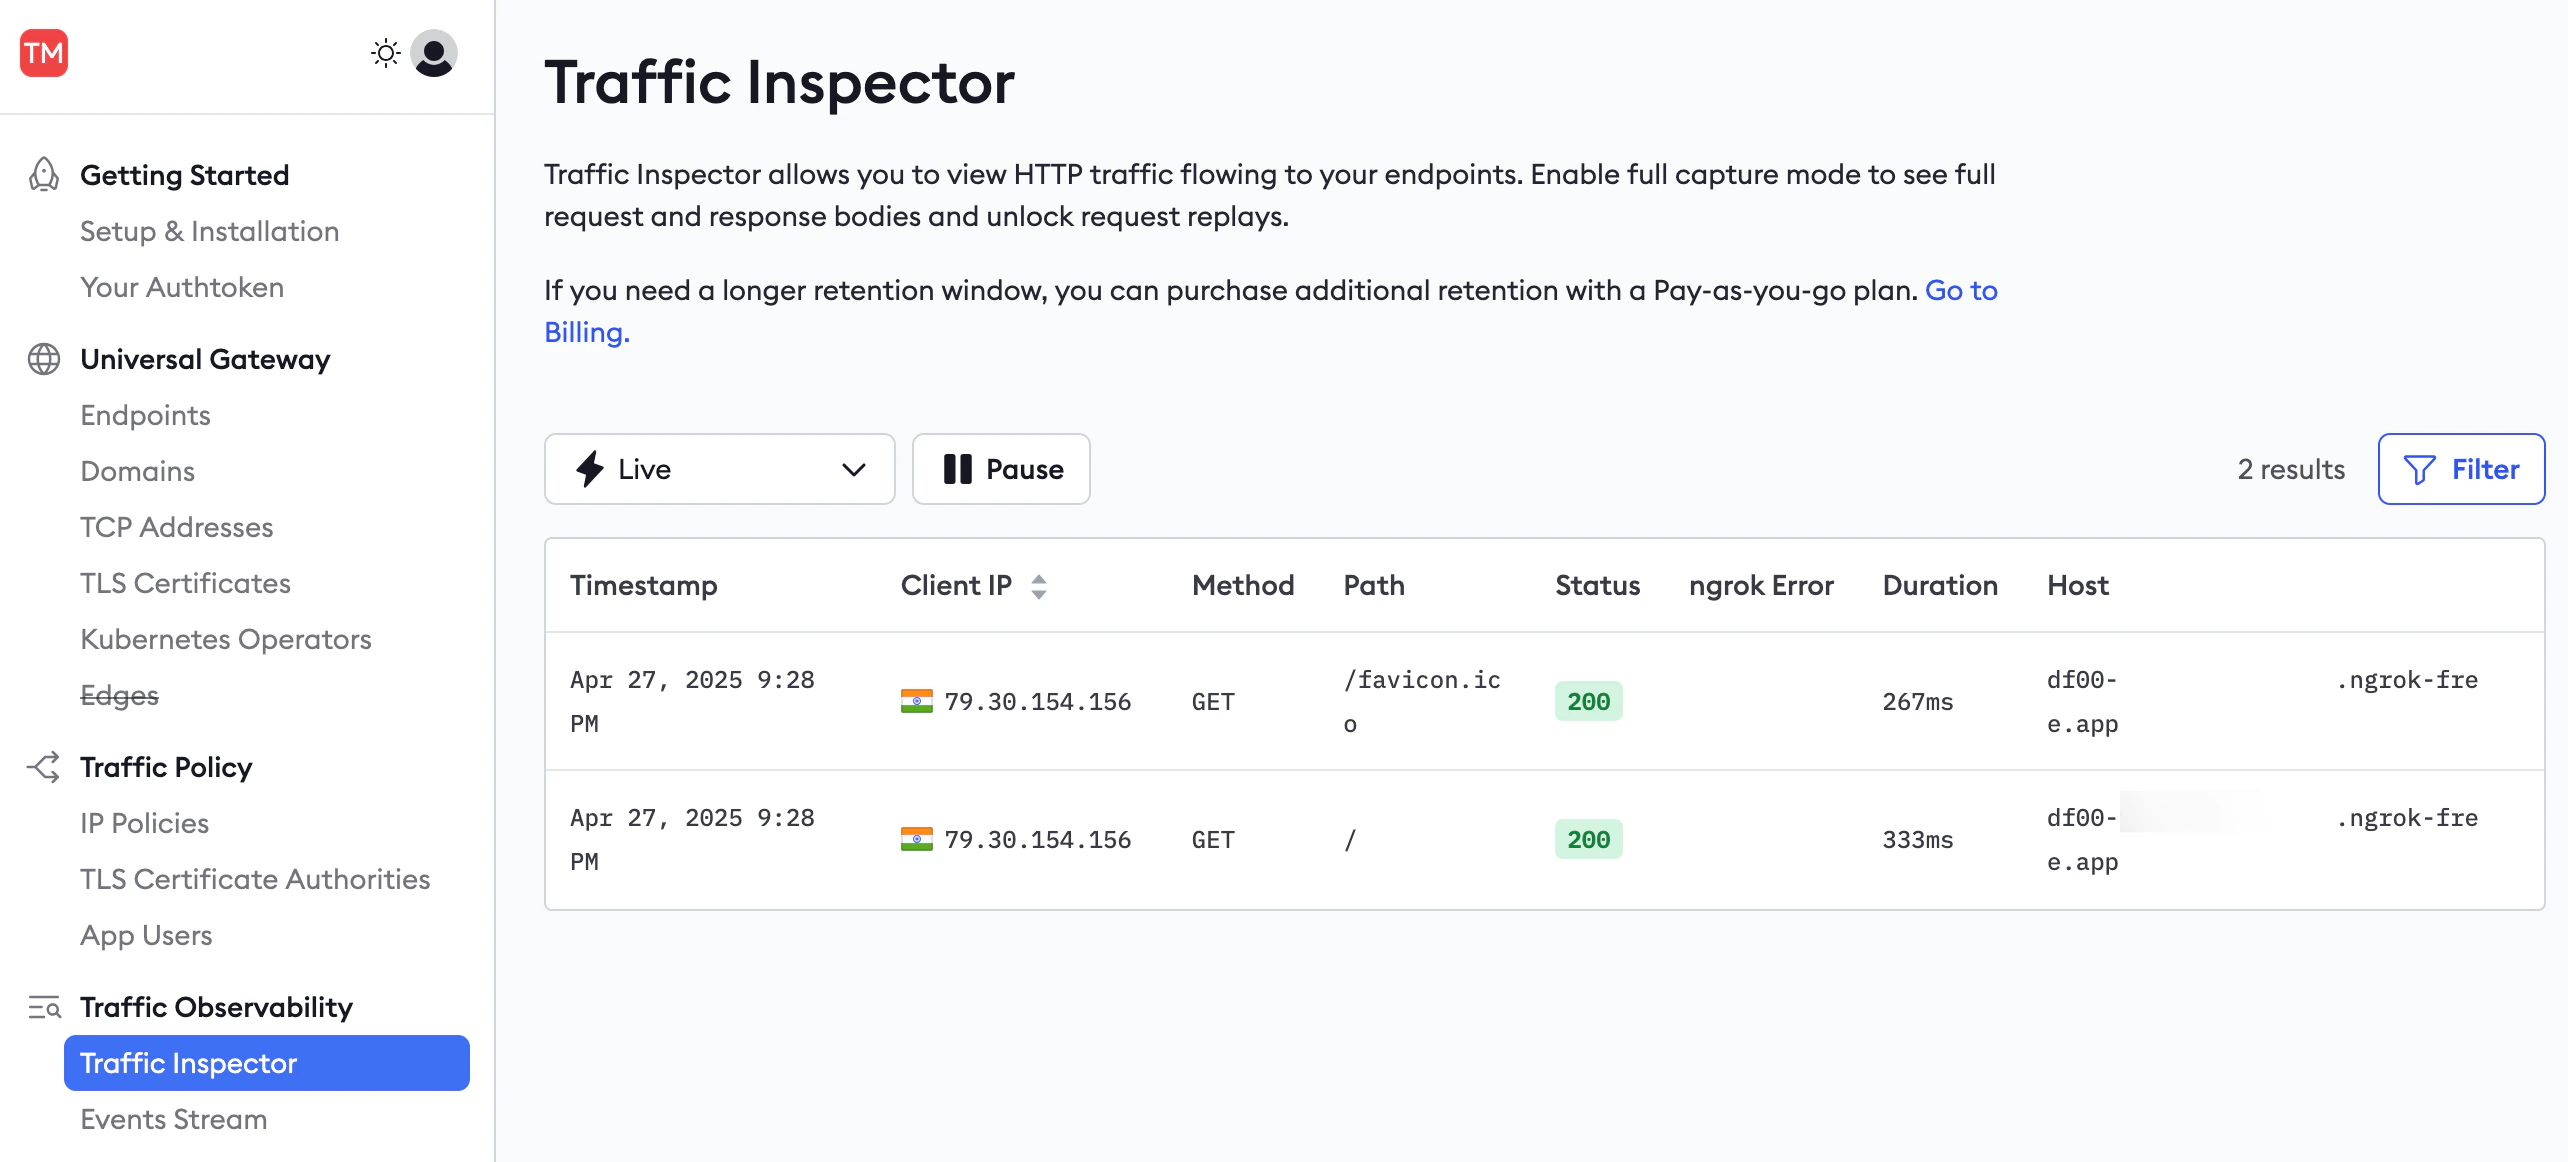
- You can filter requests by these fields—for instance, to show only server error responses and not successes.
-
Click a request in the Traffic Inspector list, then click Enable full capture in the sidebar.
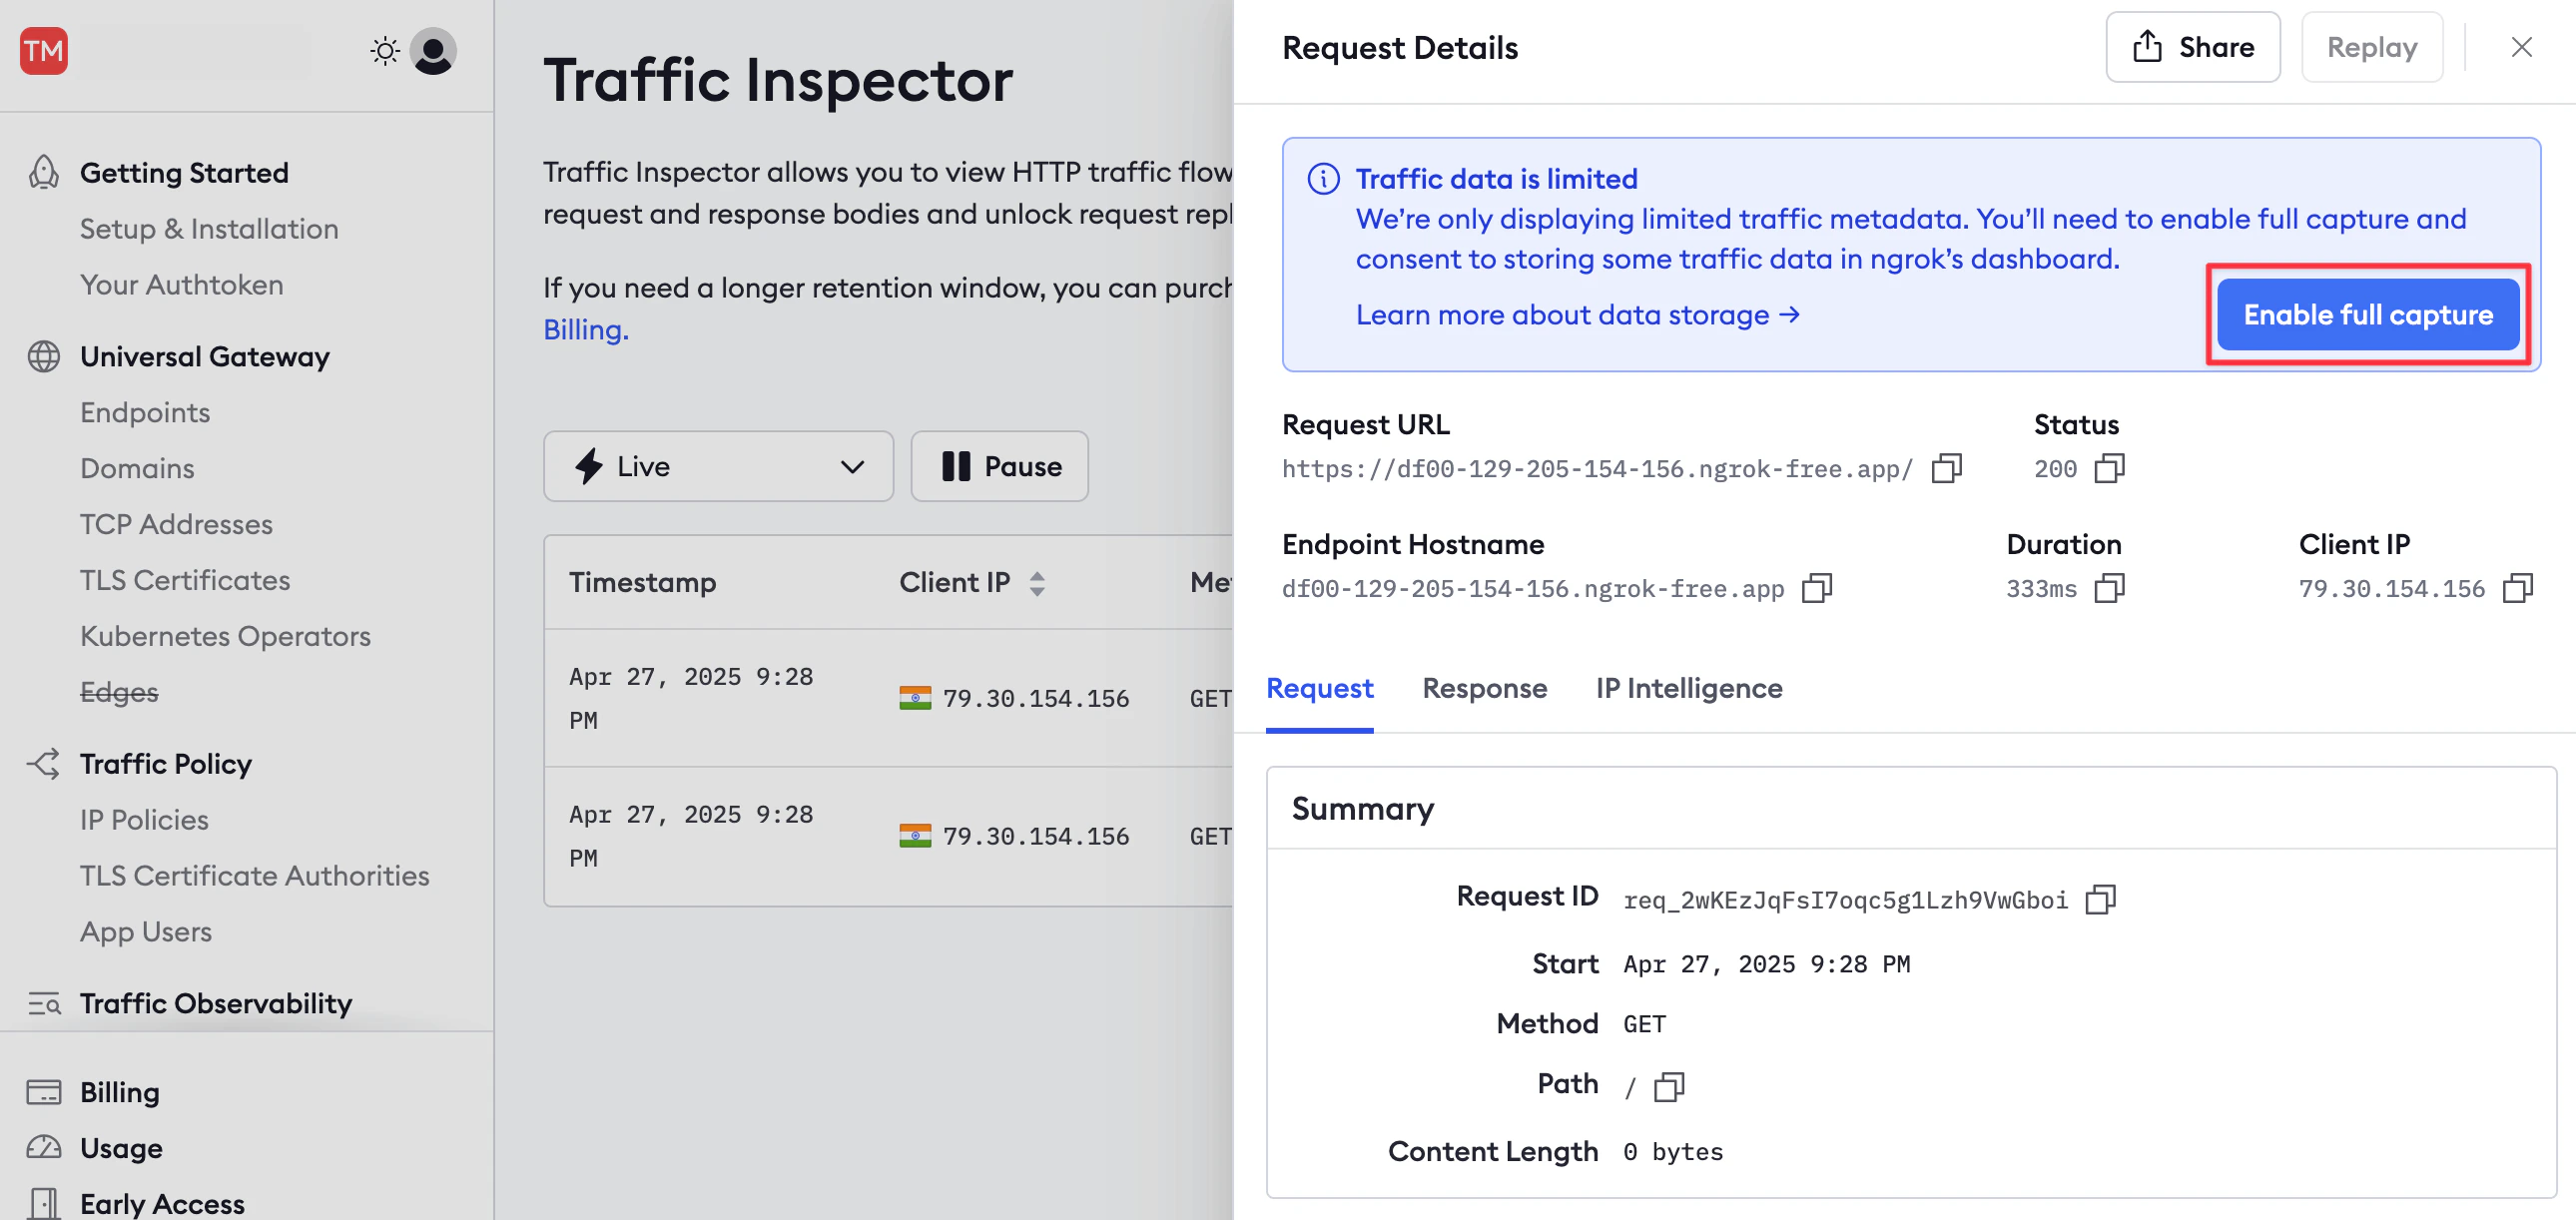
-
This button takes you to your account settings, where you can enable full capture under Observability.
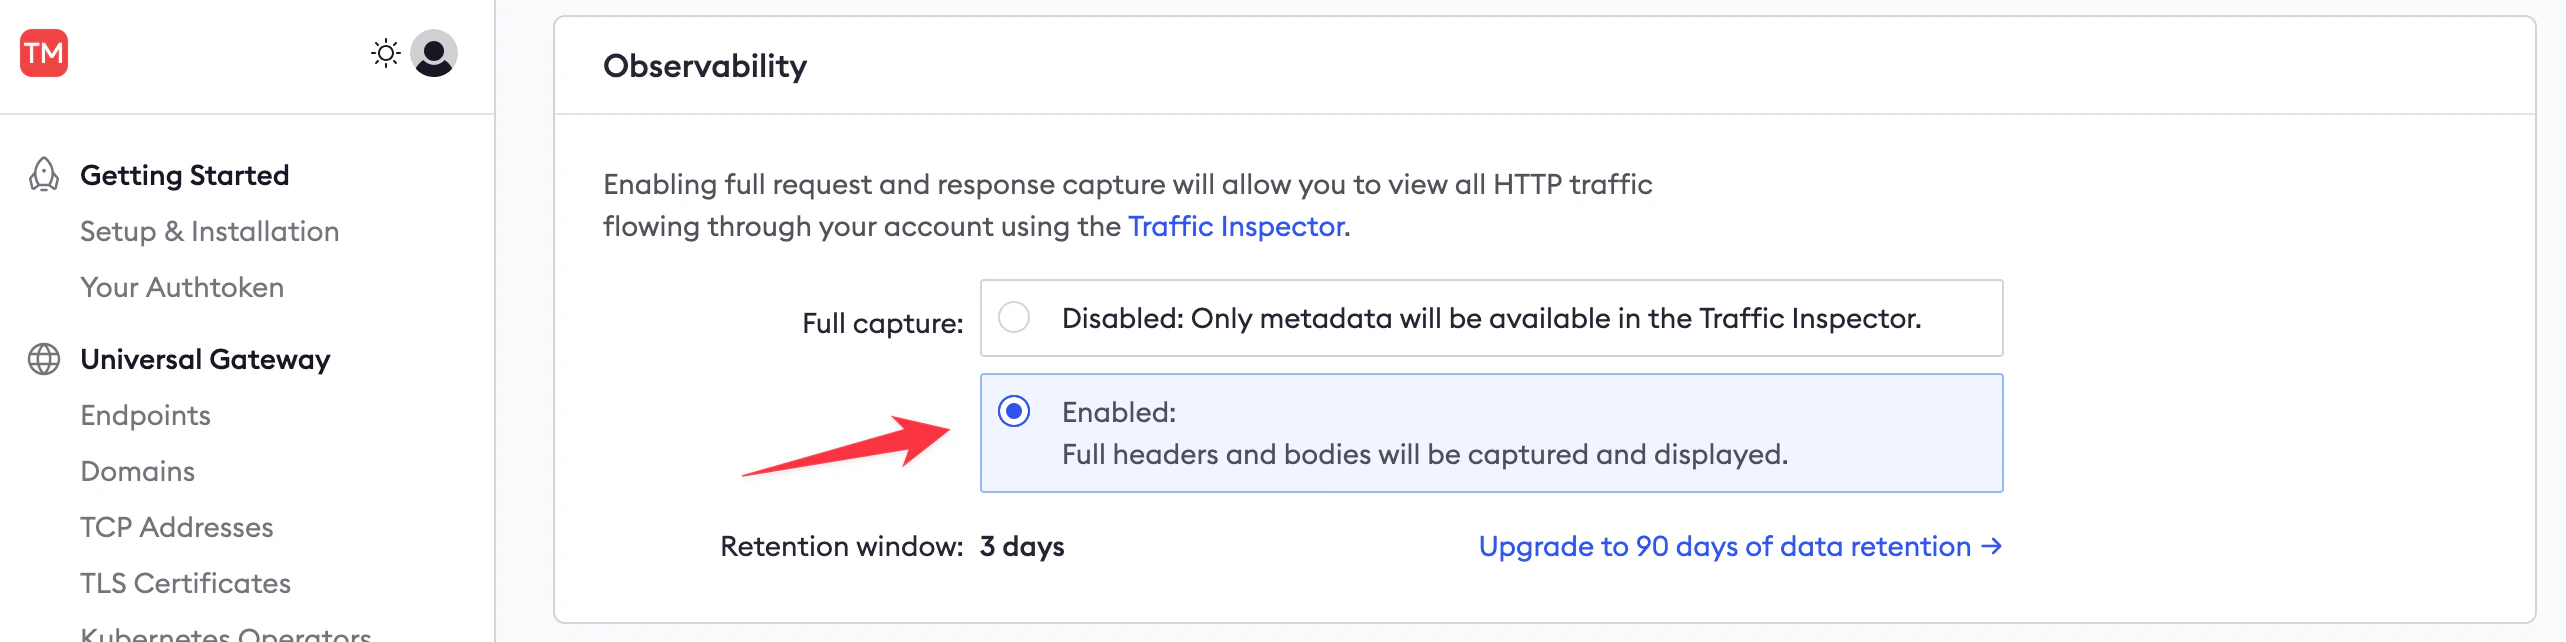
- Then, return to your published API URL and refresh the browser page a few times to send fresh requests through ngrok.
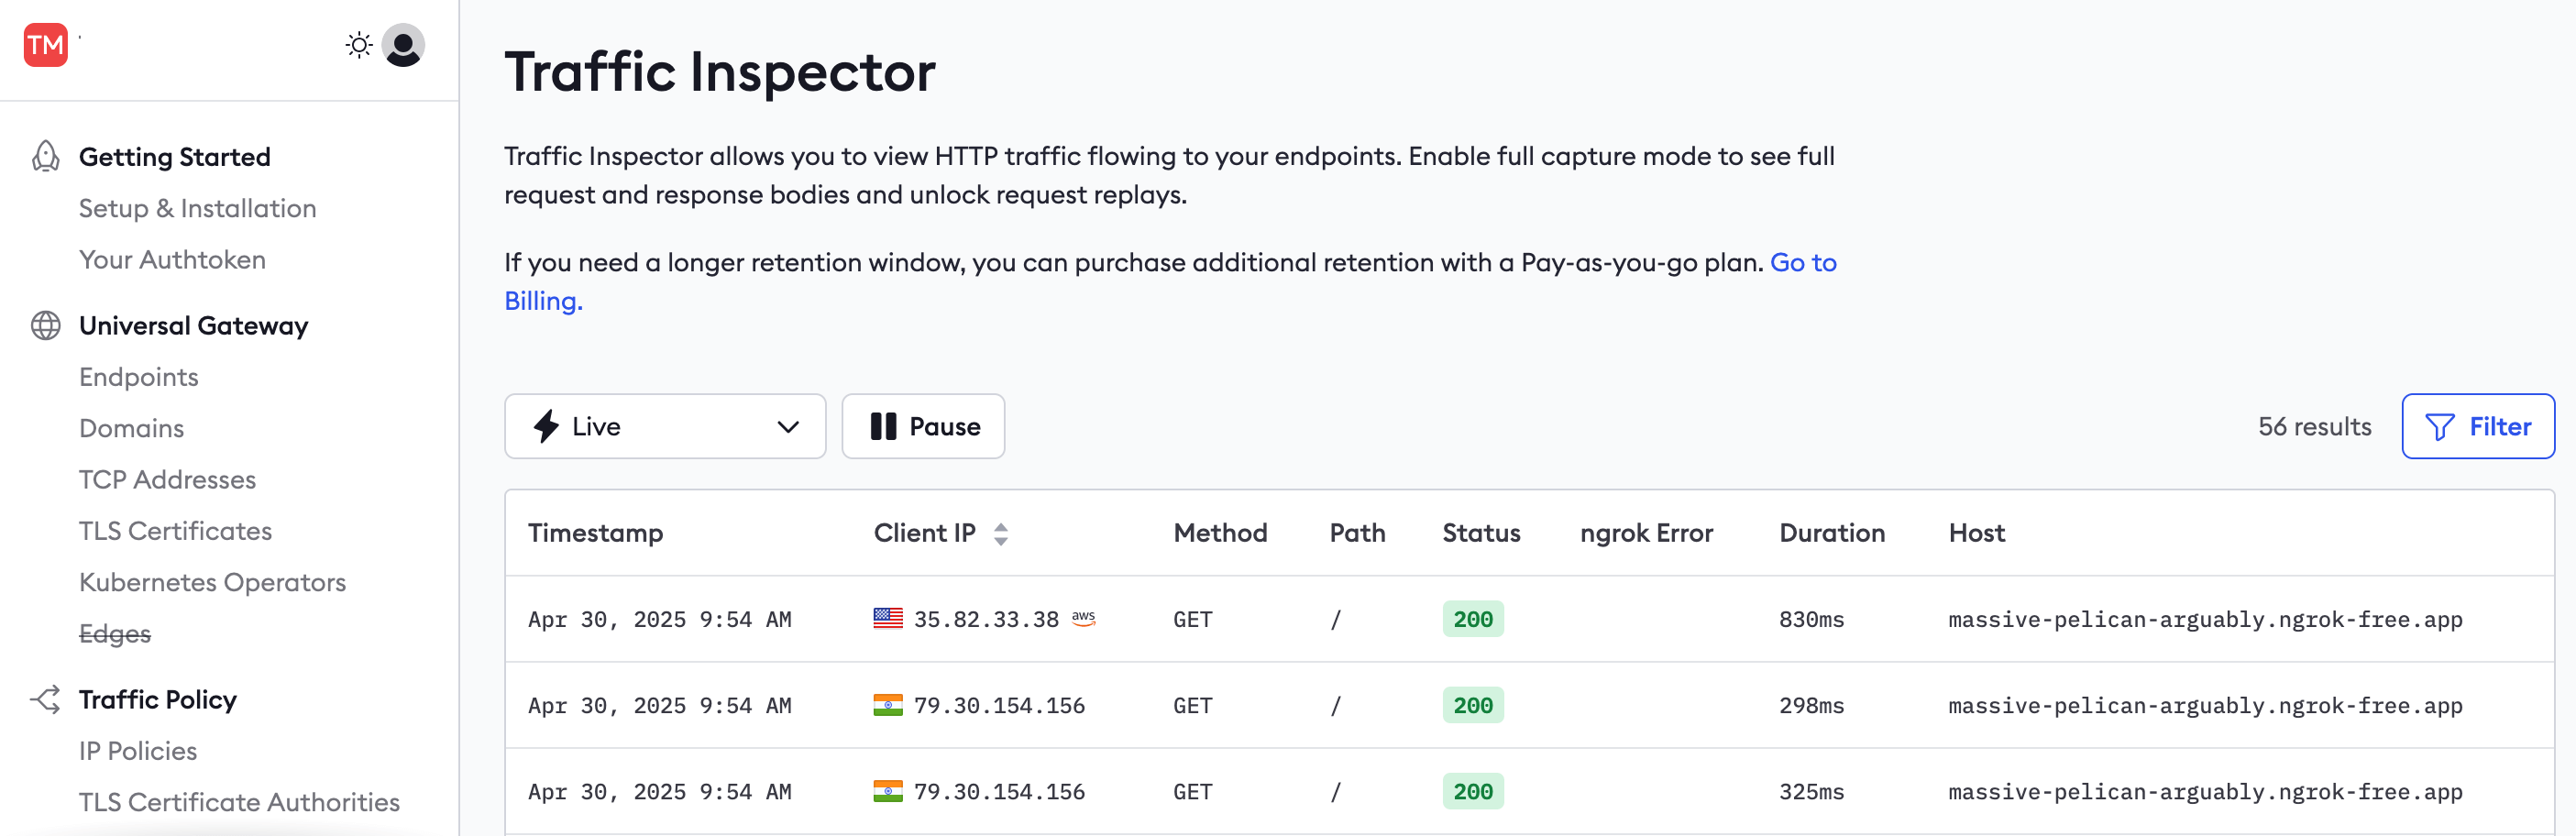
- In the ngrok Traffic Inspector, click the event at the top of the list. The event should now show all the request and response details and content. If the full capture details don’t appear, you may need to restart your ngrok agent in the terminal.
-
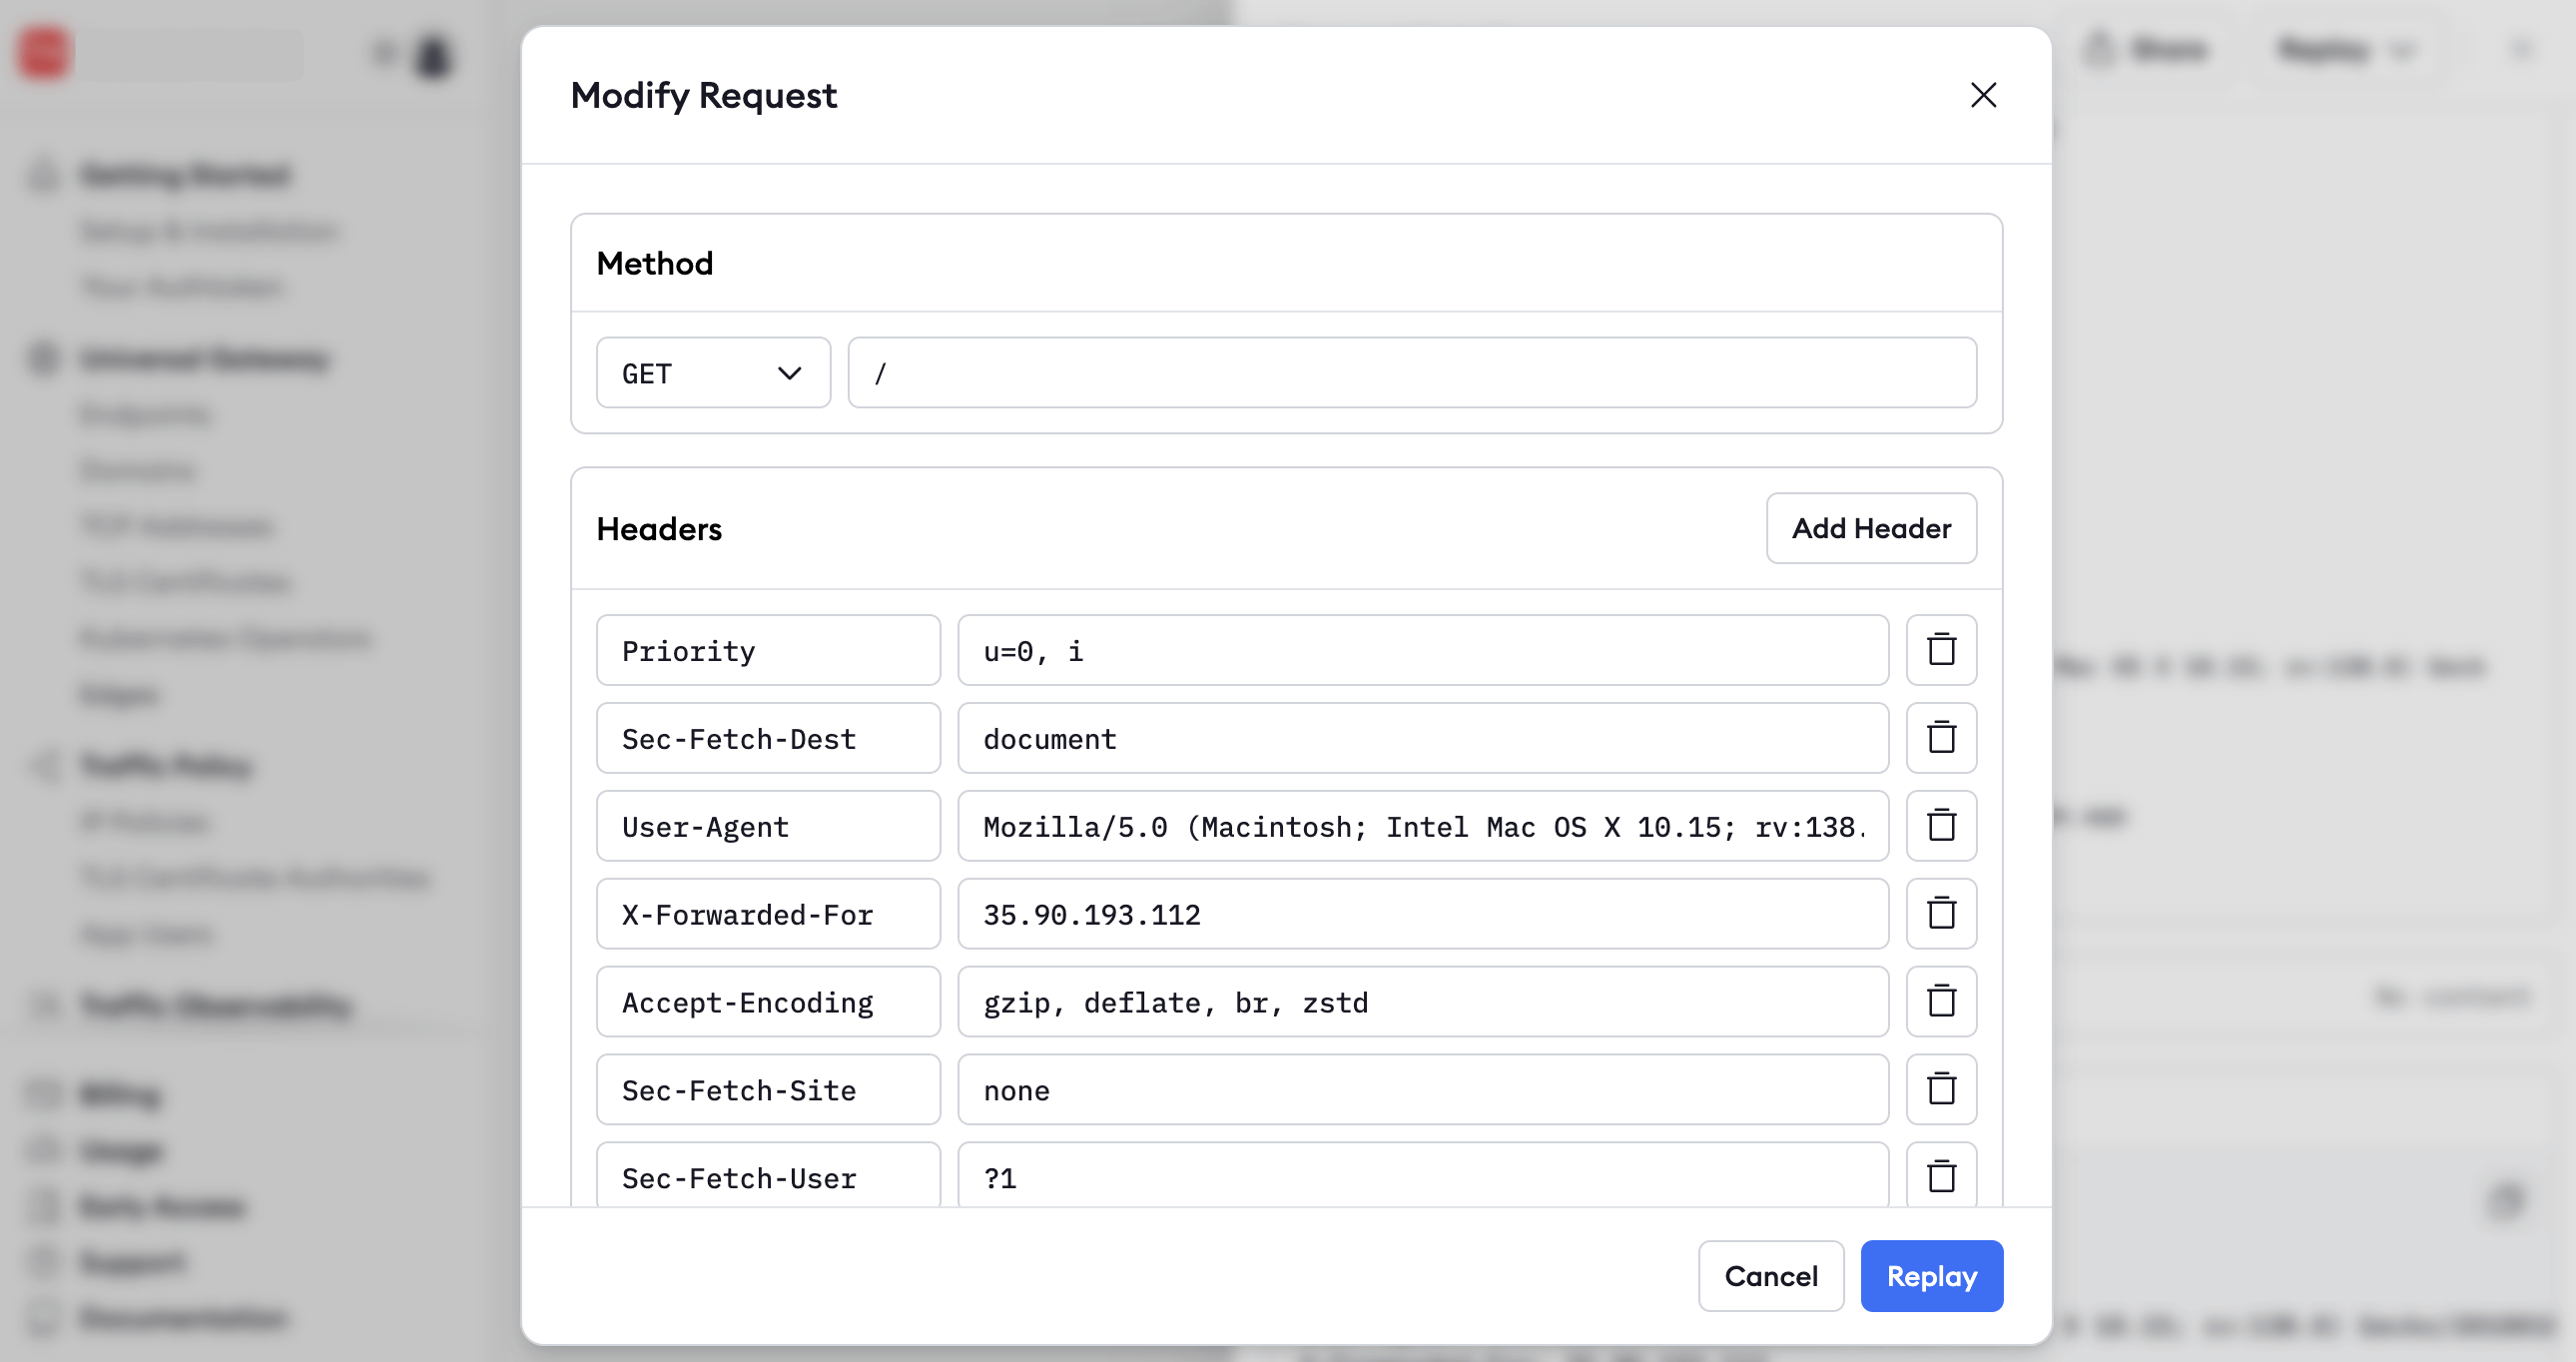
Click the Replay button and notice that the request is replayed from the ngrok host.
-
You can also replay a request with changes to alter any of the headers or POST data.
Observe and debug Traffic Policy rules with request replay
You can also replay requests to test new Traffic Policy rules. ngrok applies the Traffic Policy rules in effect at the current time of replay, which may be different from the rules that were in effect when the original request was received. This replay function lets you test how new Traffic Policy rules behave against real-world traffic from the past, offering one more way to test or debug them. Since you came here from a previous API gateway guide, you’ve already seen how to set up therate-limit action.
Now you can observe what happens to rate-limited requests and also use Traffic Inspector to dial in your threshold.
-
Hit your endpoint a few more times with a loop of the
curlcommand: -
In Traffic Inspector, note that ngrok returned the error code
429(rate limit) and that the duration of the request was instant, meaning it created no load on your API.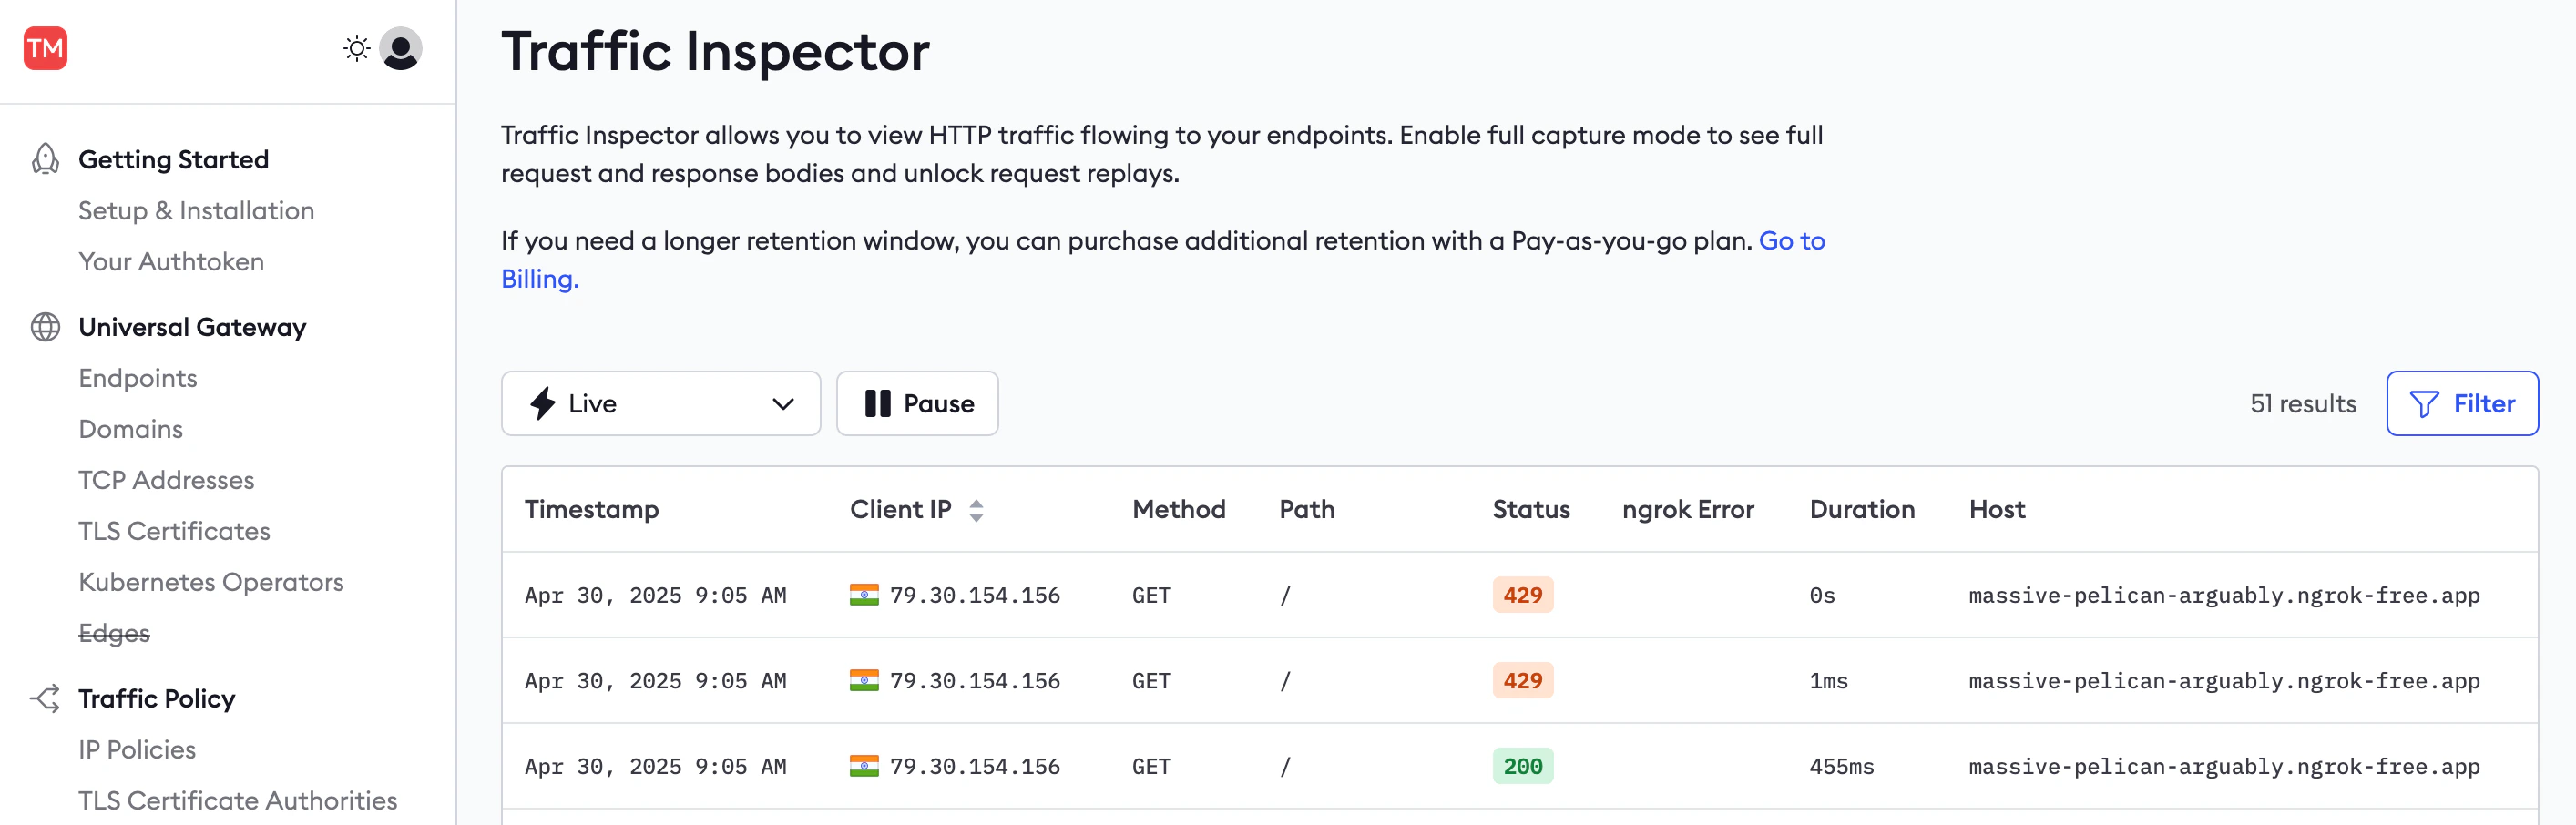
-
Edit the
policy.ymlfile and changecapacityto100or another threshold you deem appropriate and restart your agent based on your form factor. -
In the Traffic Inspector, click one of the
429events, then click Replay. Note that the request now responds without error because you increased the rate limit for the given IP address of that request.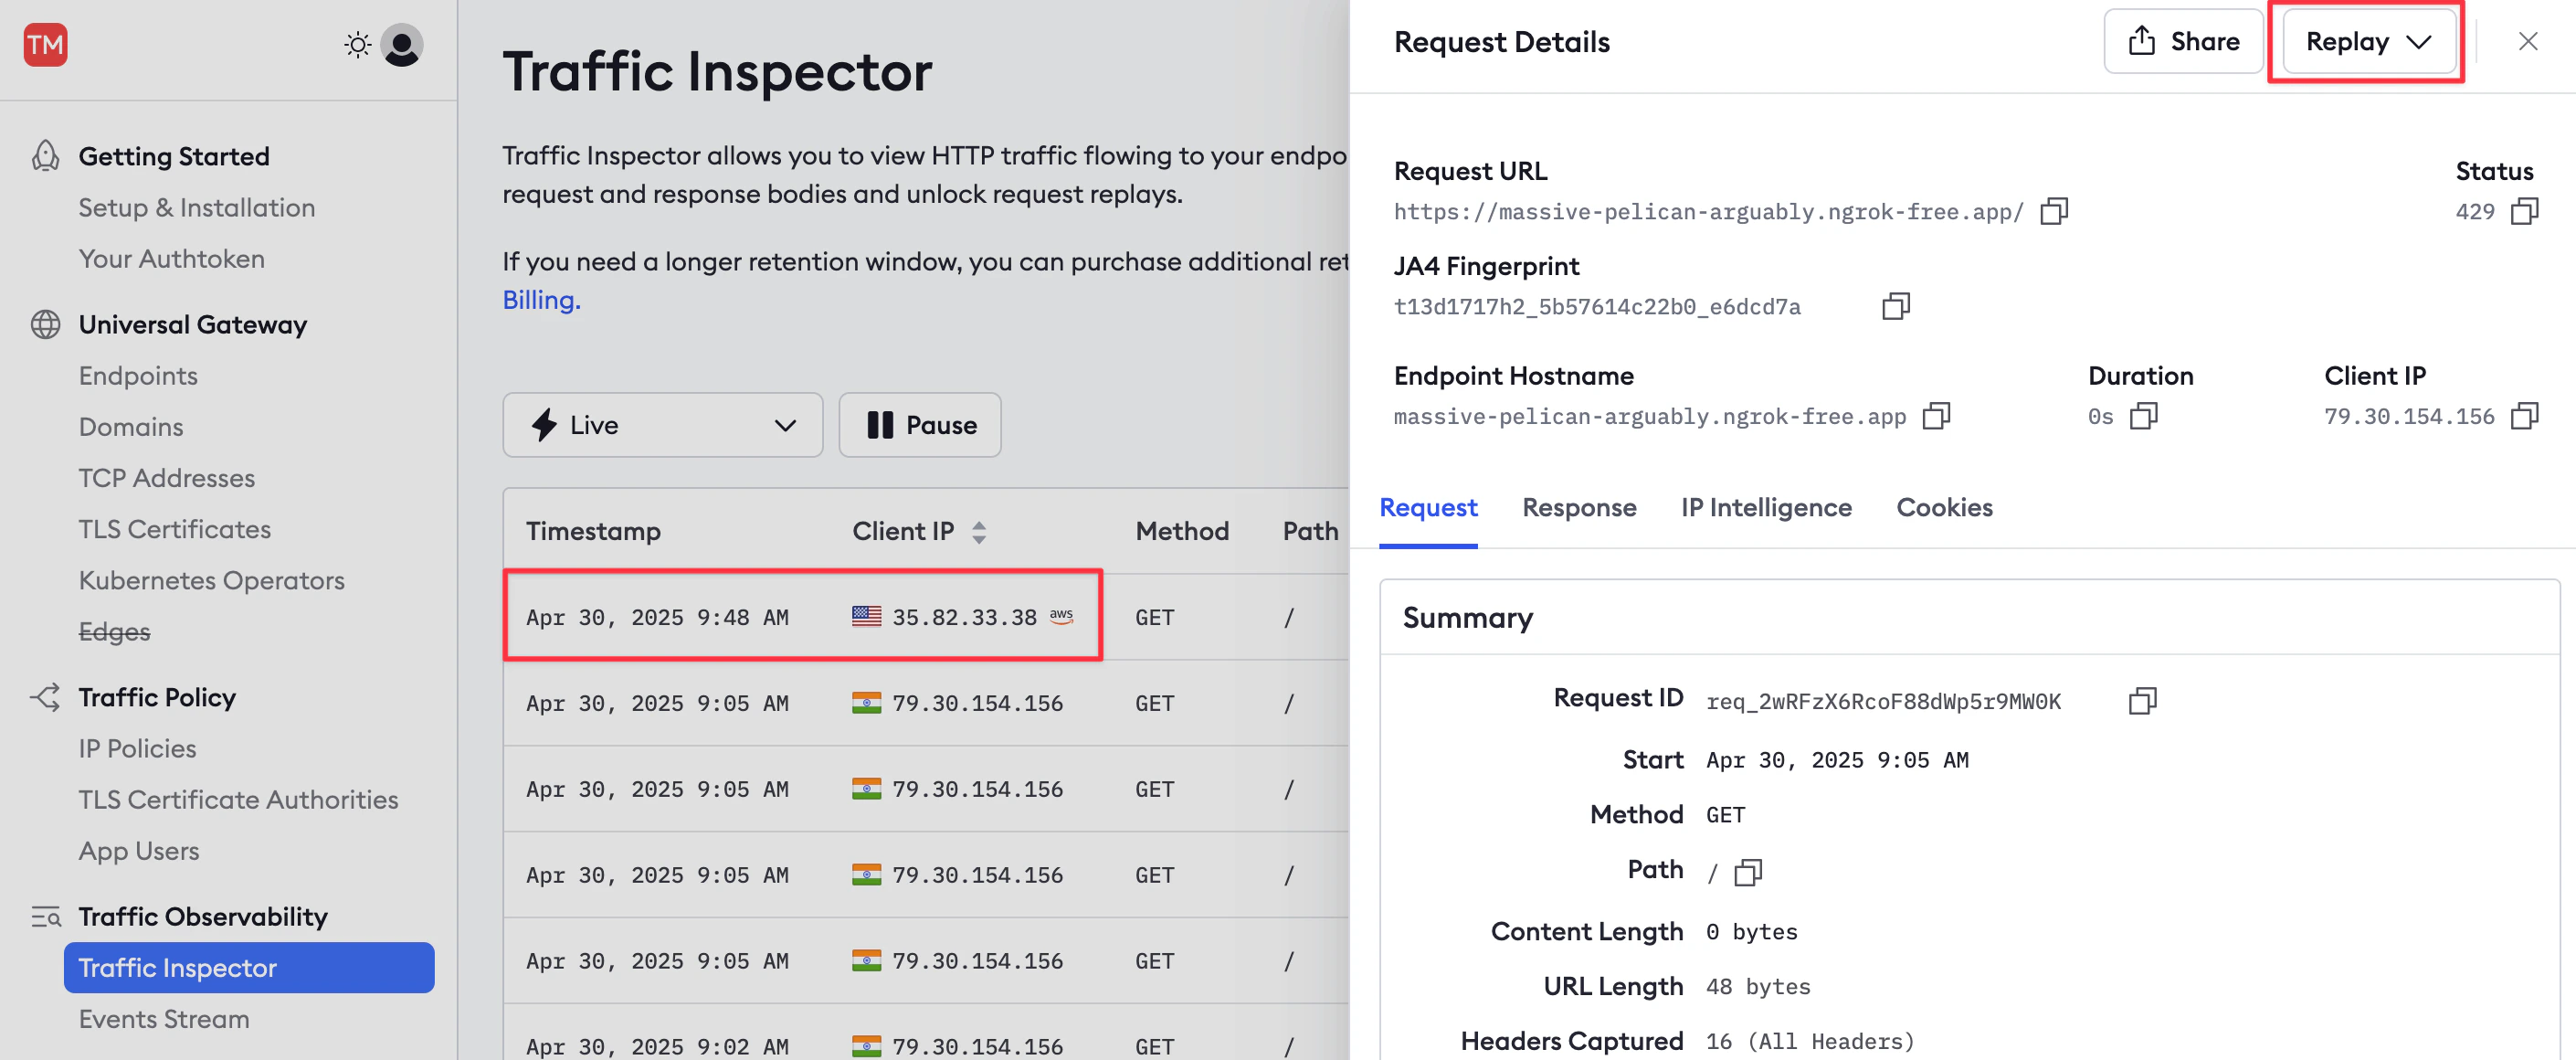
Monitor your API gateway traffic with Datadog
In this section, you’ll learn how to export ngrok events to the Datadog monitoring service. There are two types of events: standard traffic events (requests to your API) and audit events (changes to secret keys and URLs). For this simple example, you’ll monitor a traffic event.-
In the ngrok dashboard, browse to Log Exporting and add a new Log Export.
-
In the New Log Export sidebar, enter
trafficas the Description and then Add a new log source. Choosehttp_request_complete.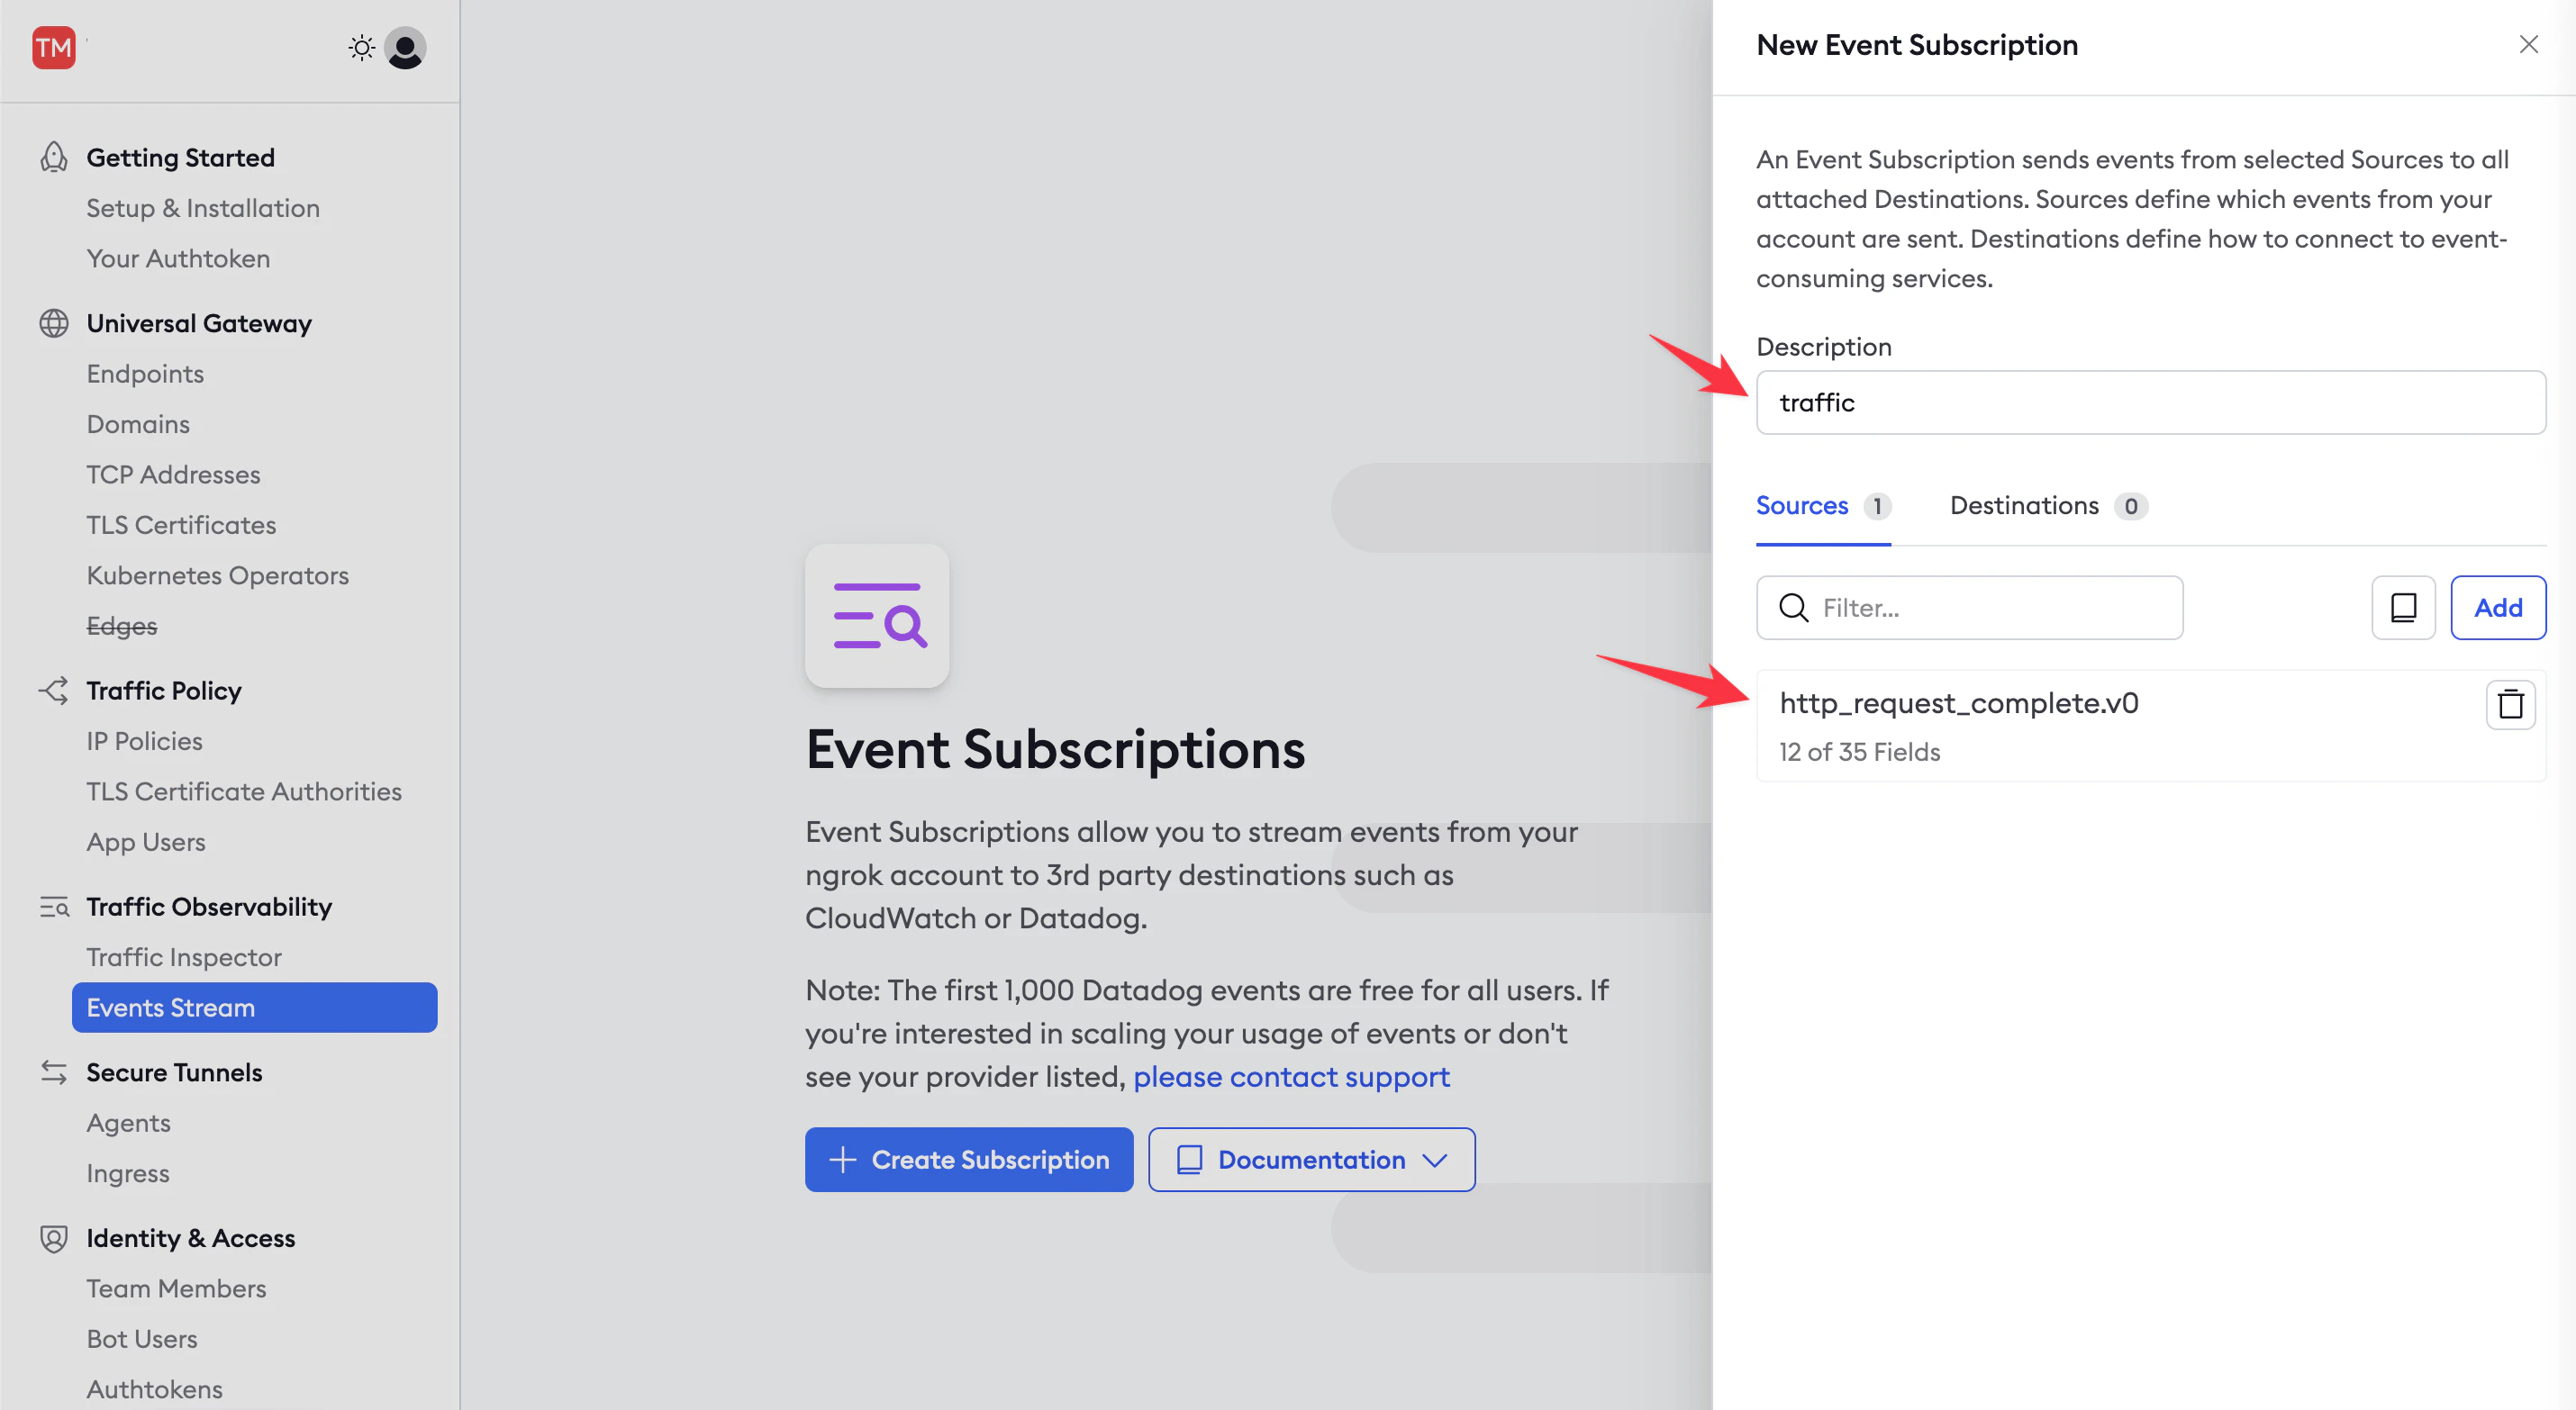
- Add Datadog as a destination, add the Datadog site and API key you noted earlier, and send a test log.
-
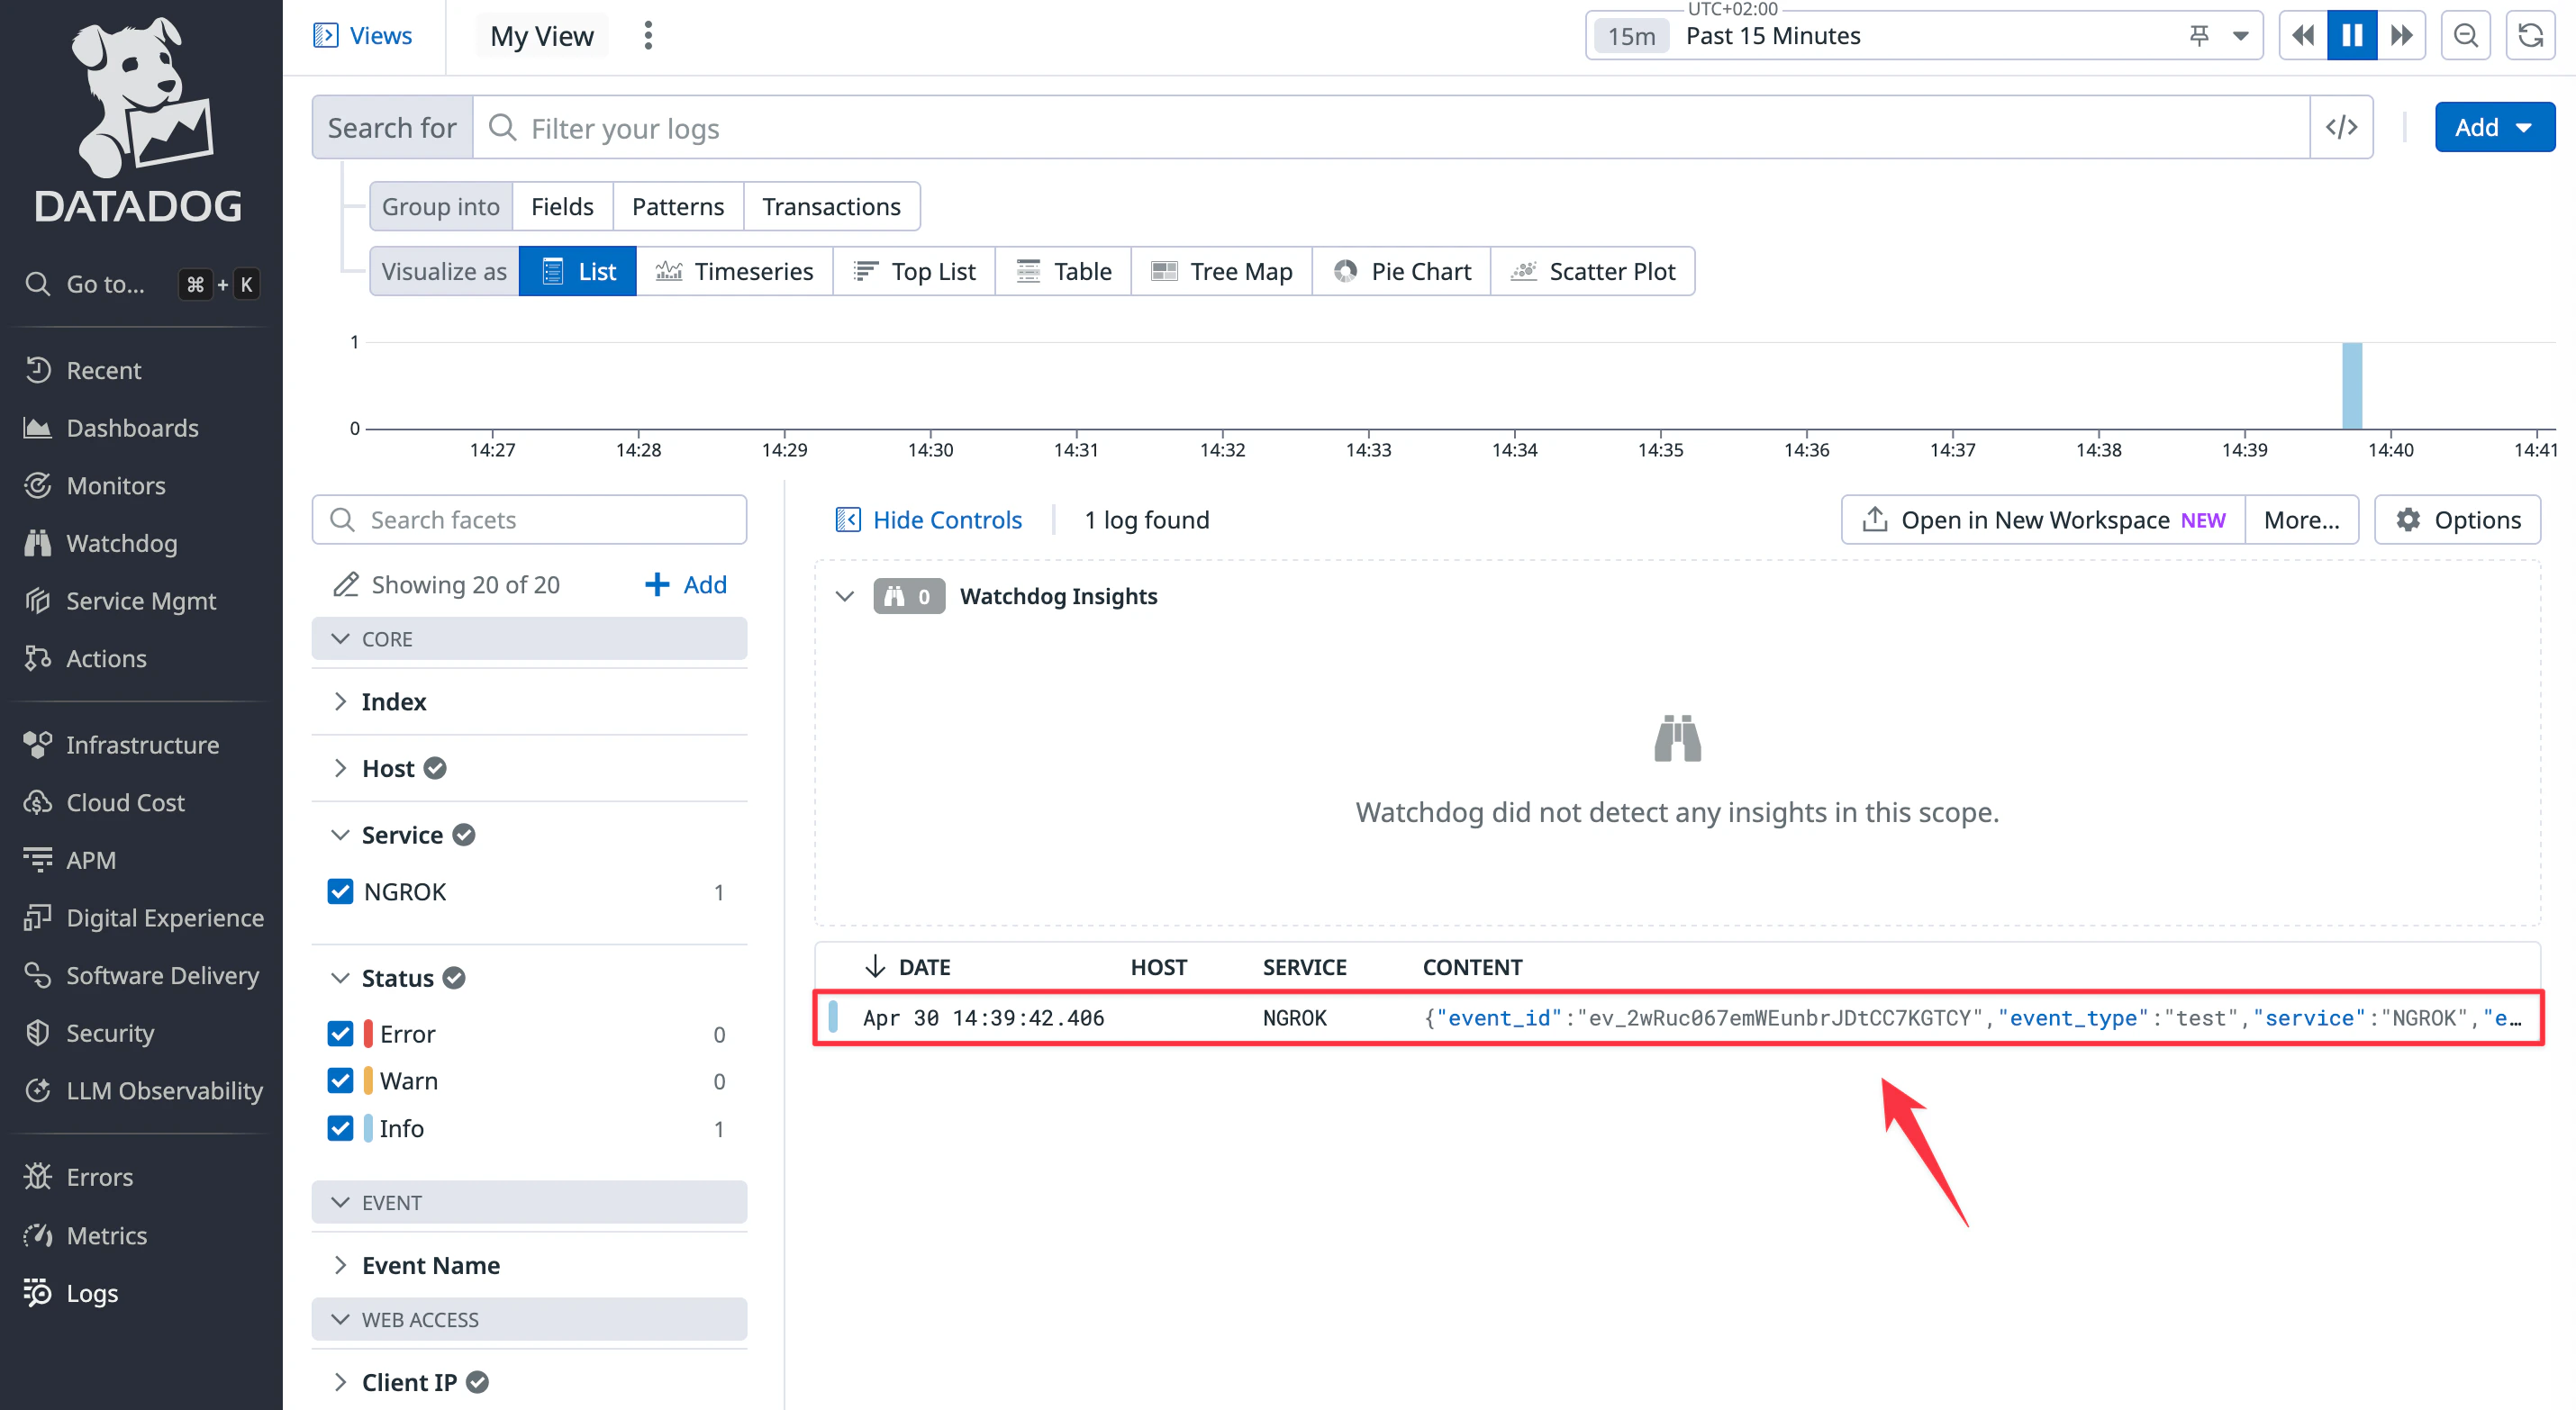
Open the Datadog site and browse to the Log Explorer page from the navigation panel.
Enable logs.
You should see that the log from ngrok has appeared.
- In ngrok, click Done and Save.
- Hit your API services a few times so that ngrok has sent new logs over to Datadog.
Create a dashboard
Now that events are being sent to Datadog, you can set up visualizations and notifications to allow your support team to monitor your API’s performance.-
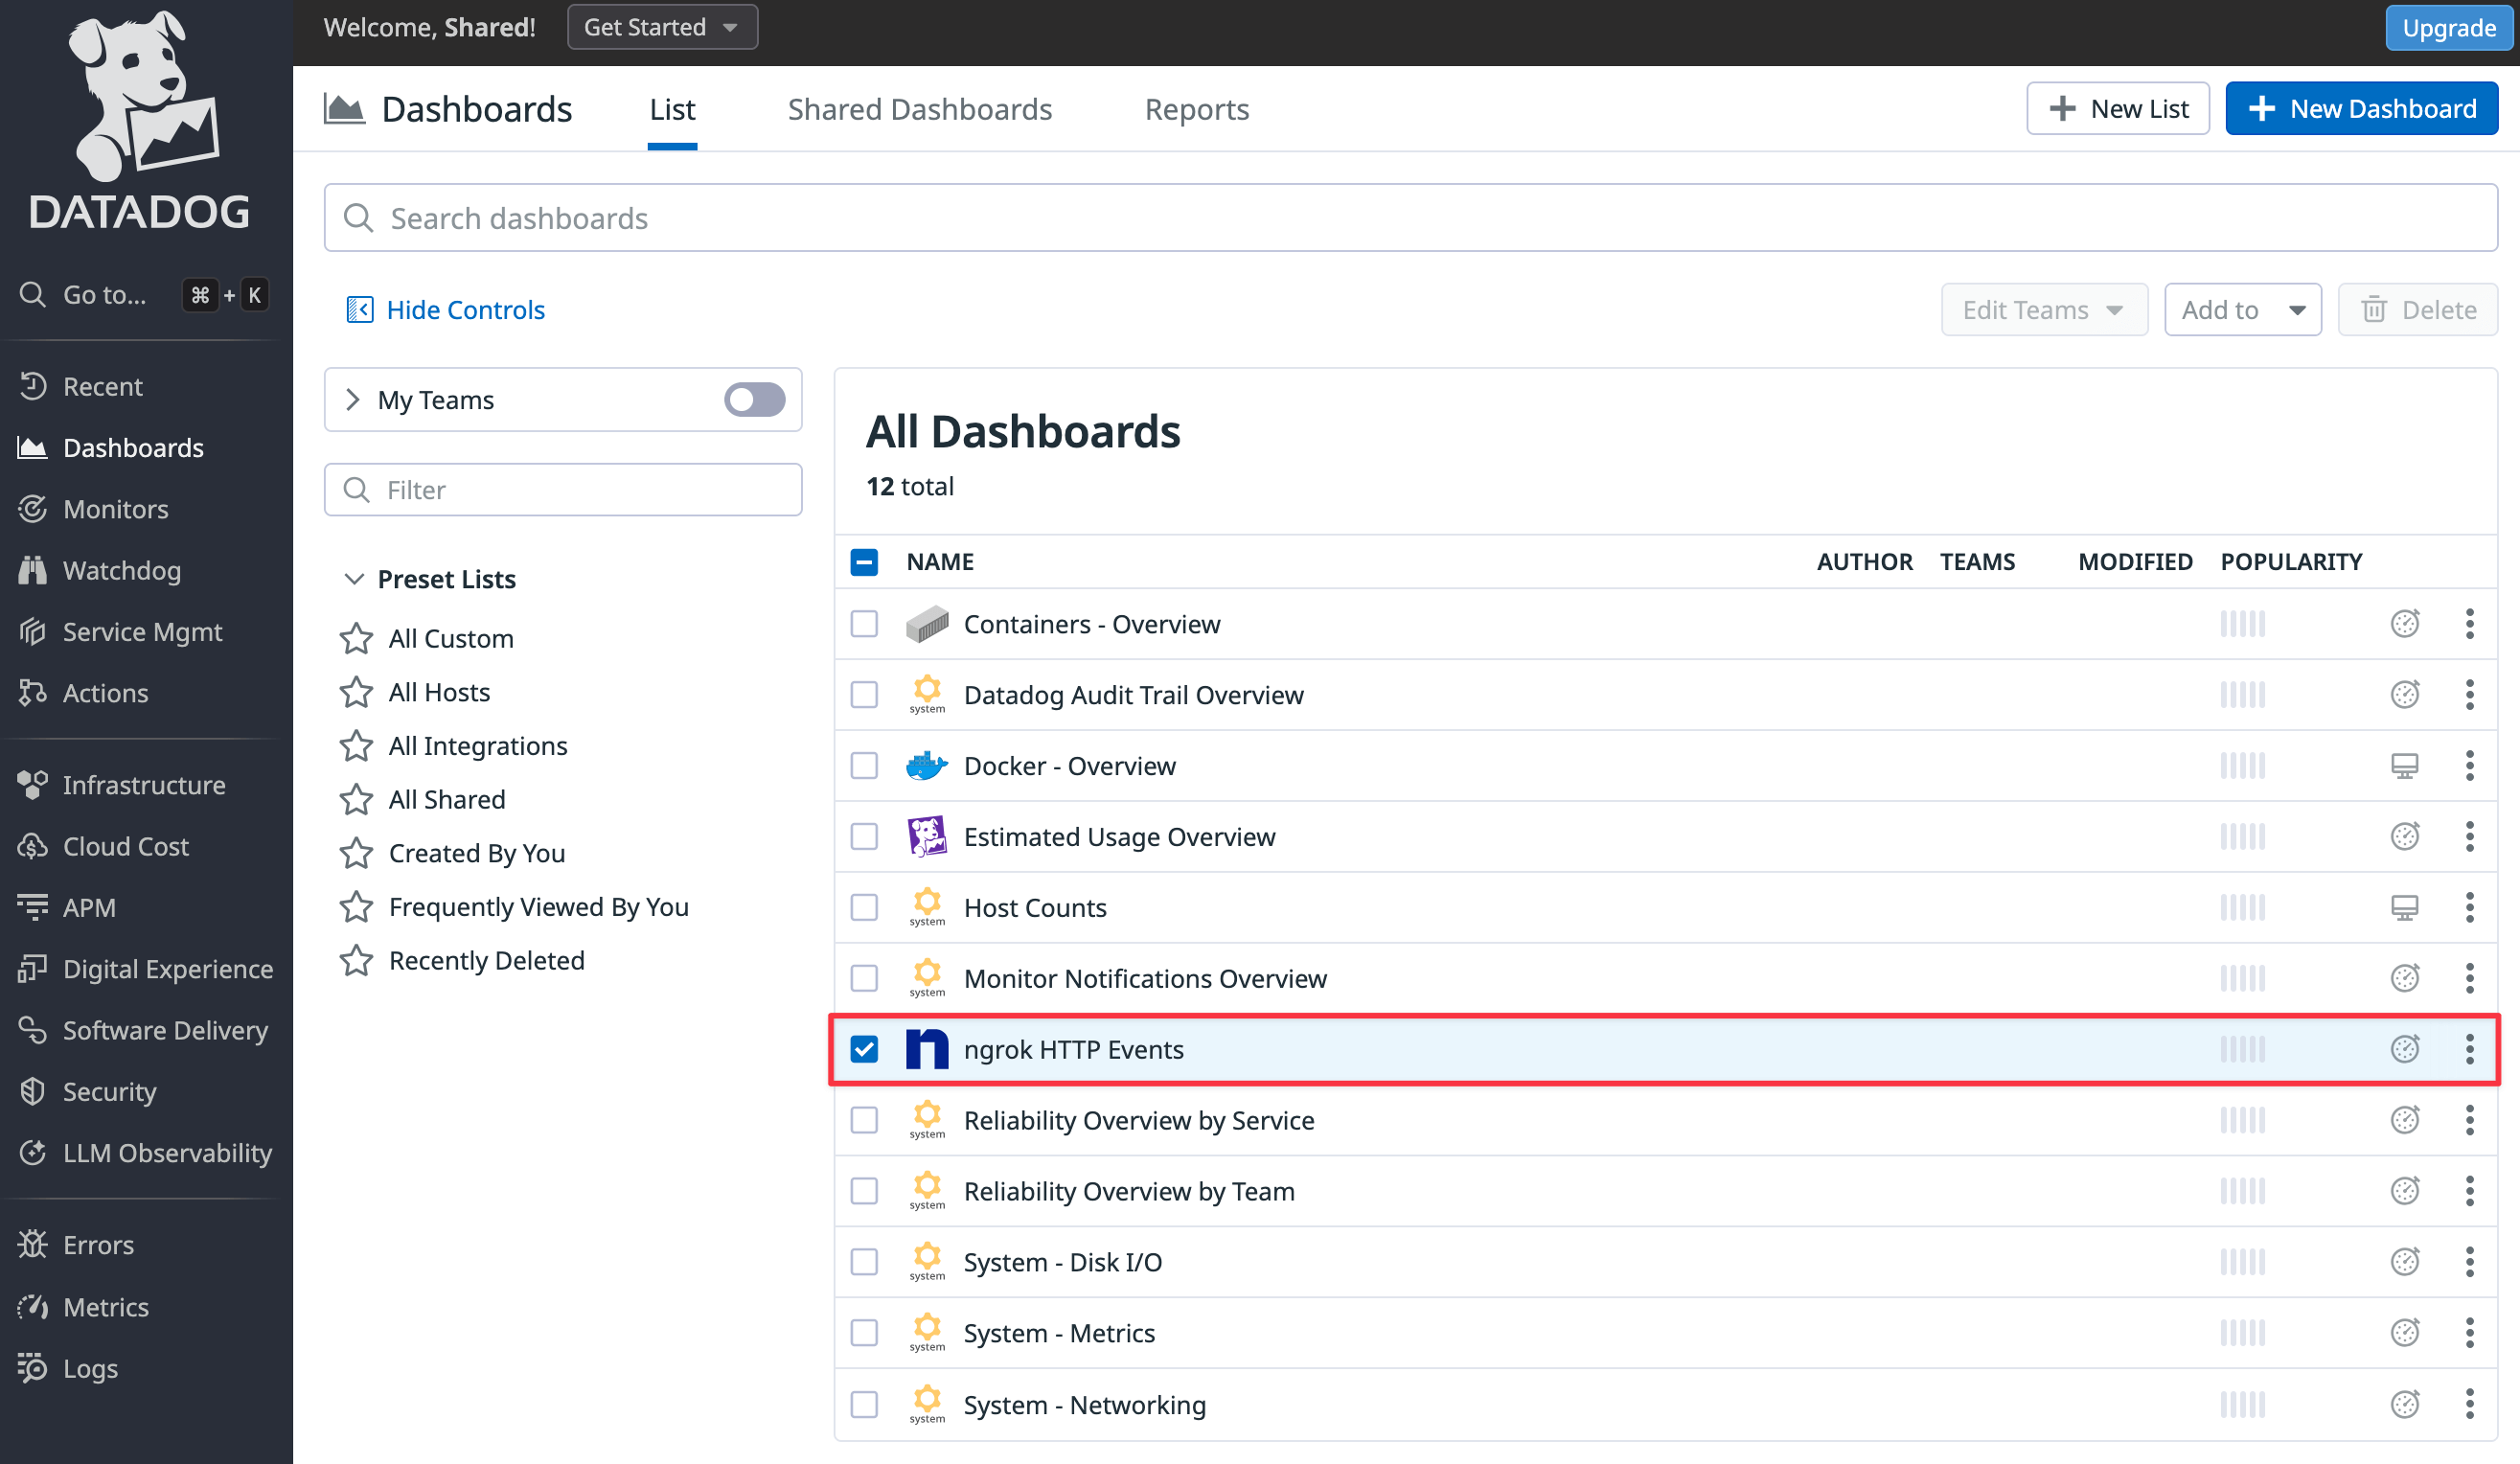
In the Datadog site, browse to the Dashboards > Dashboard List page from the navigation panel.
Click the ngrok HTTP Events item to view the default dashboard.
-
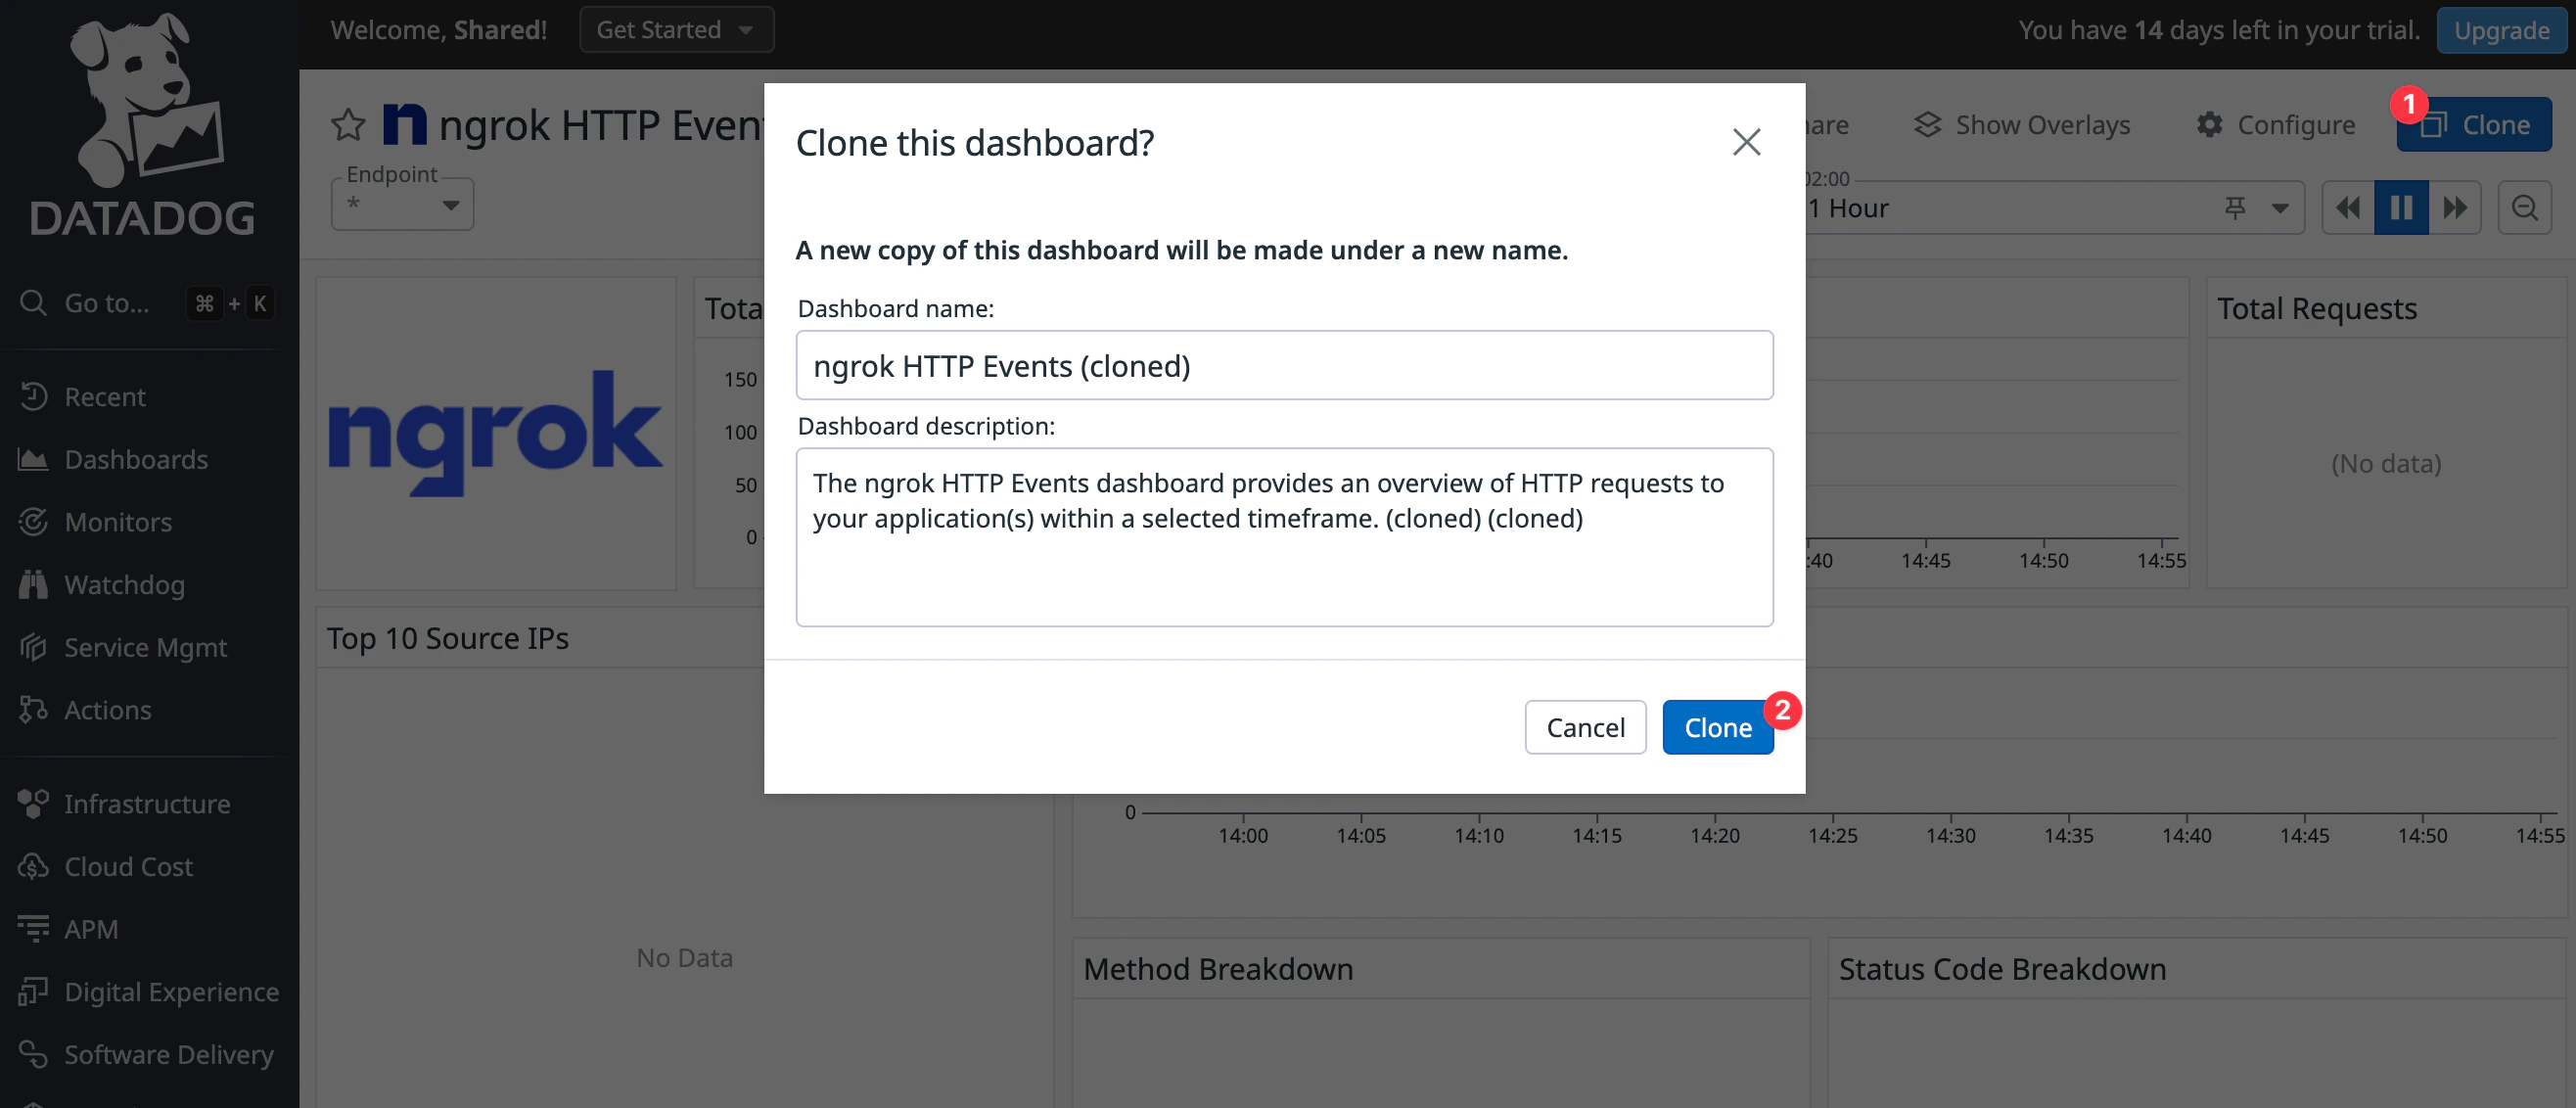
Click Clone at the top right of the page.
-
In the cloned dashboard, click Add widgets.
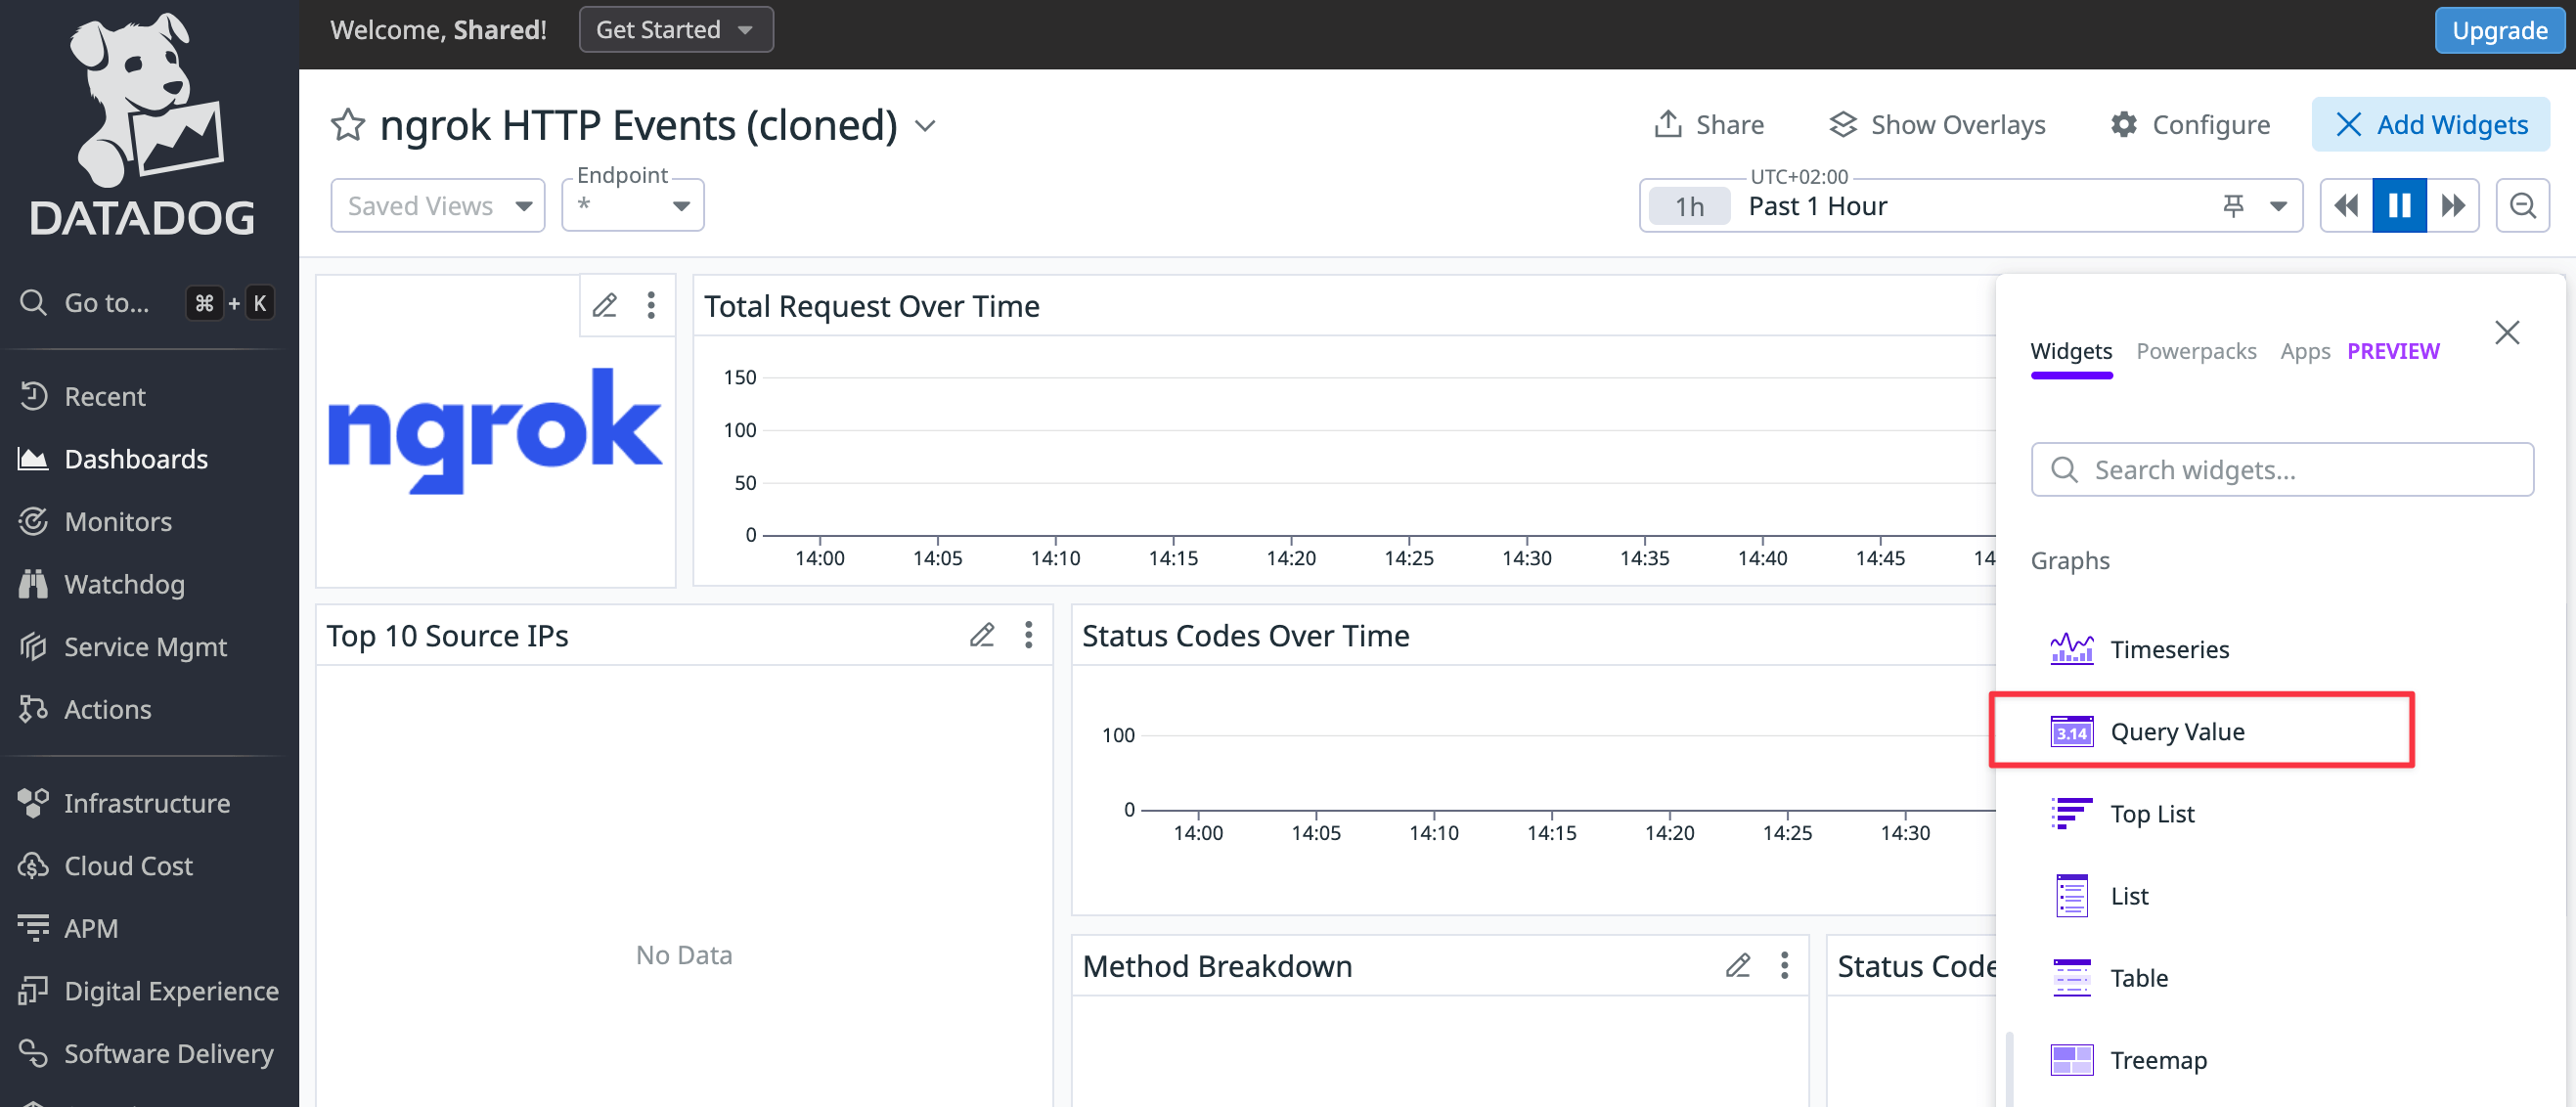
-
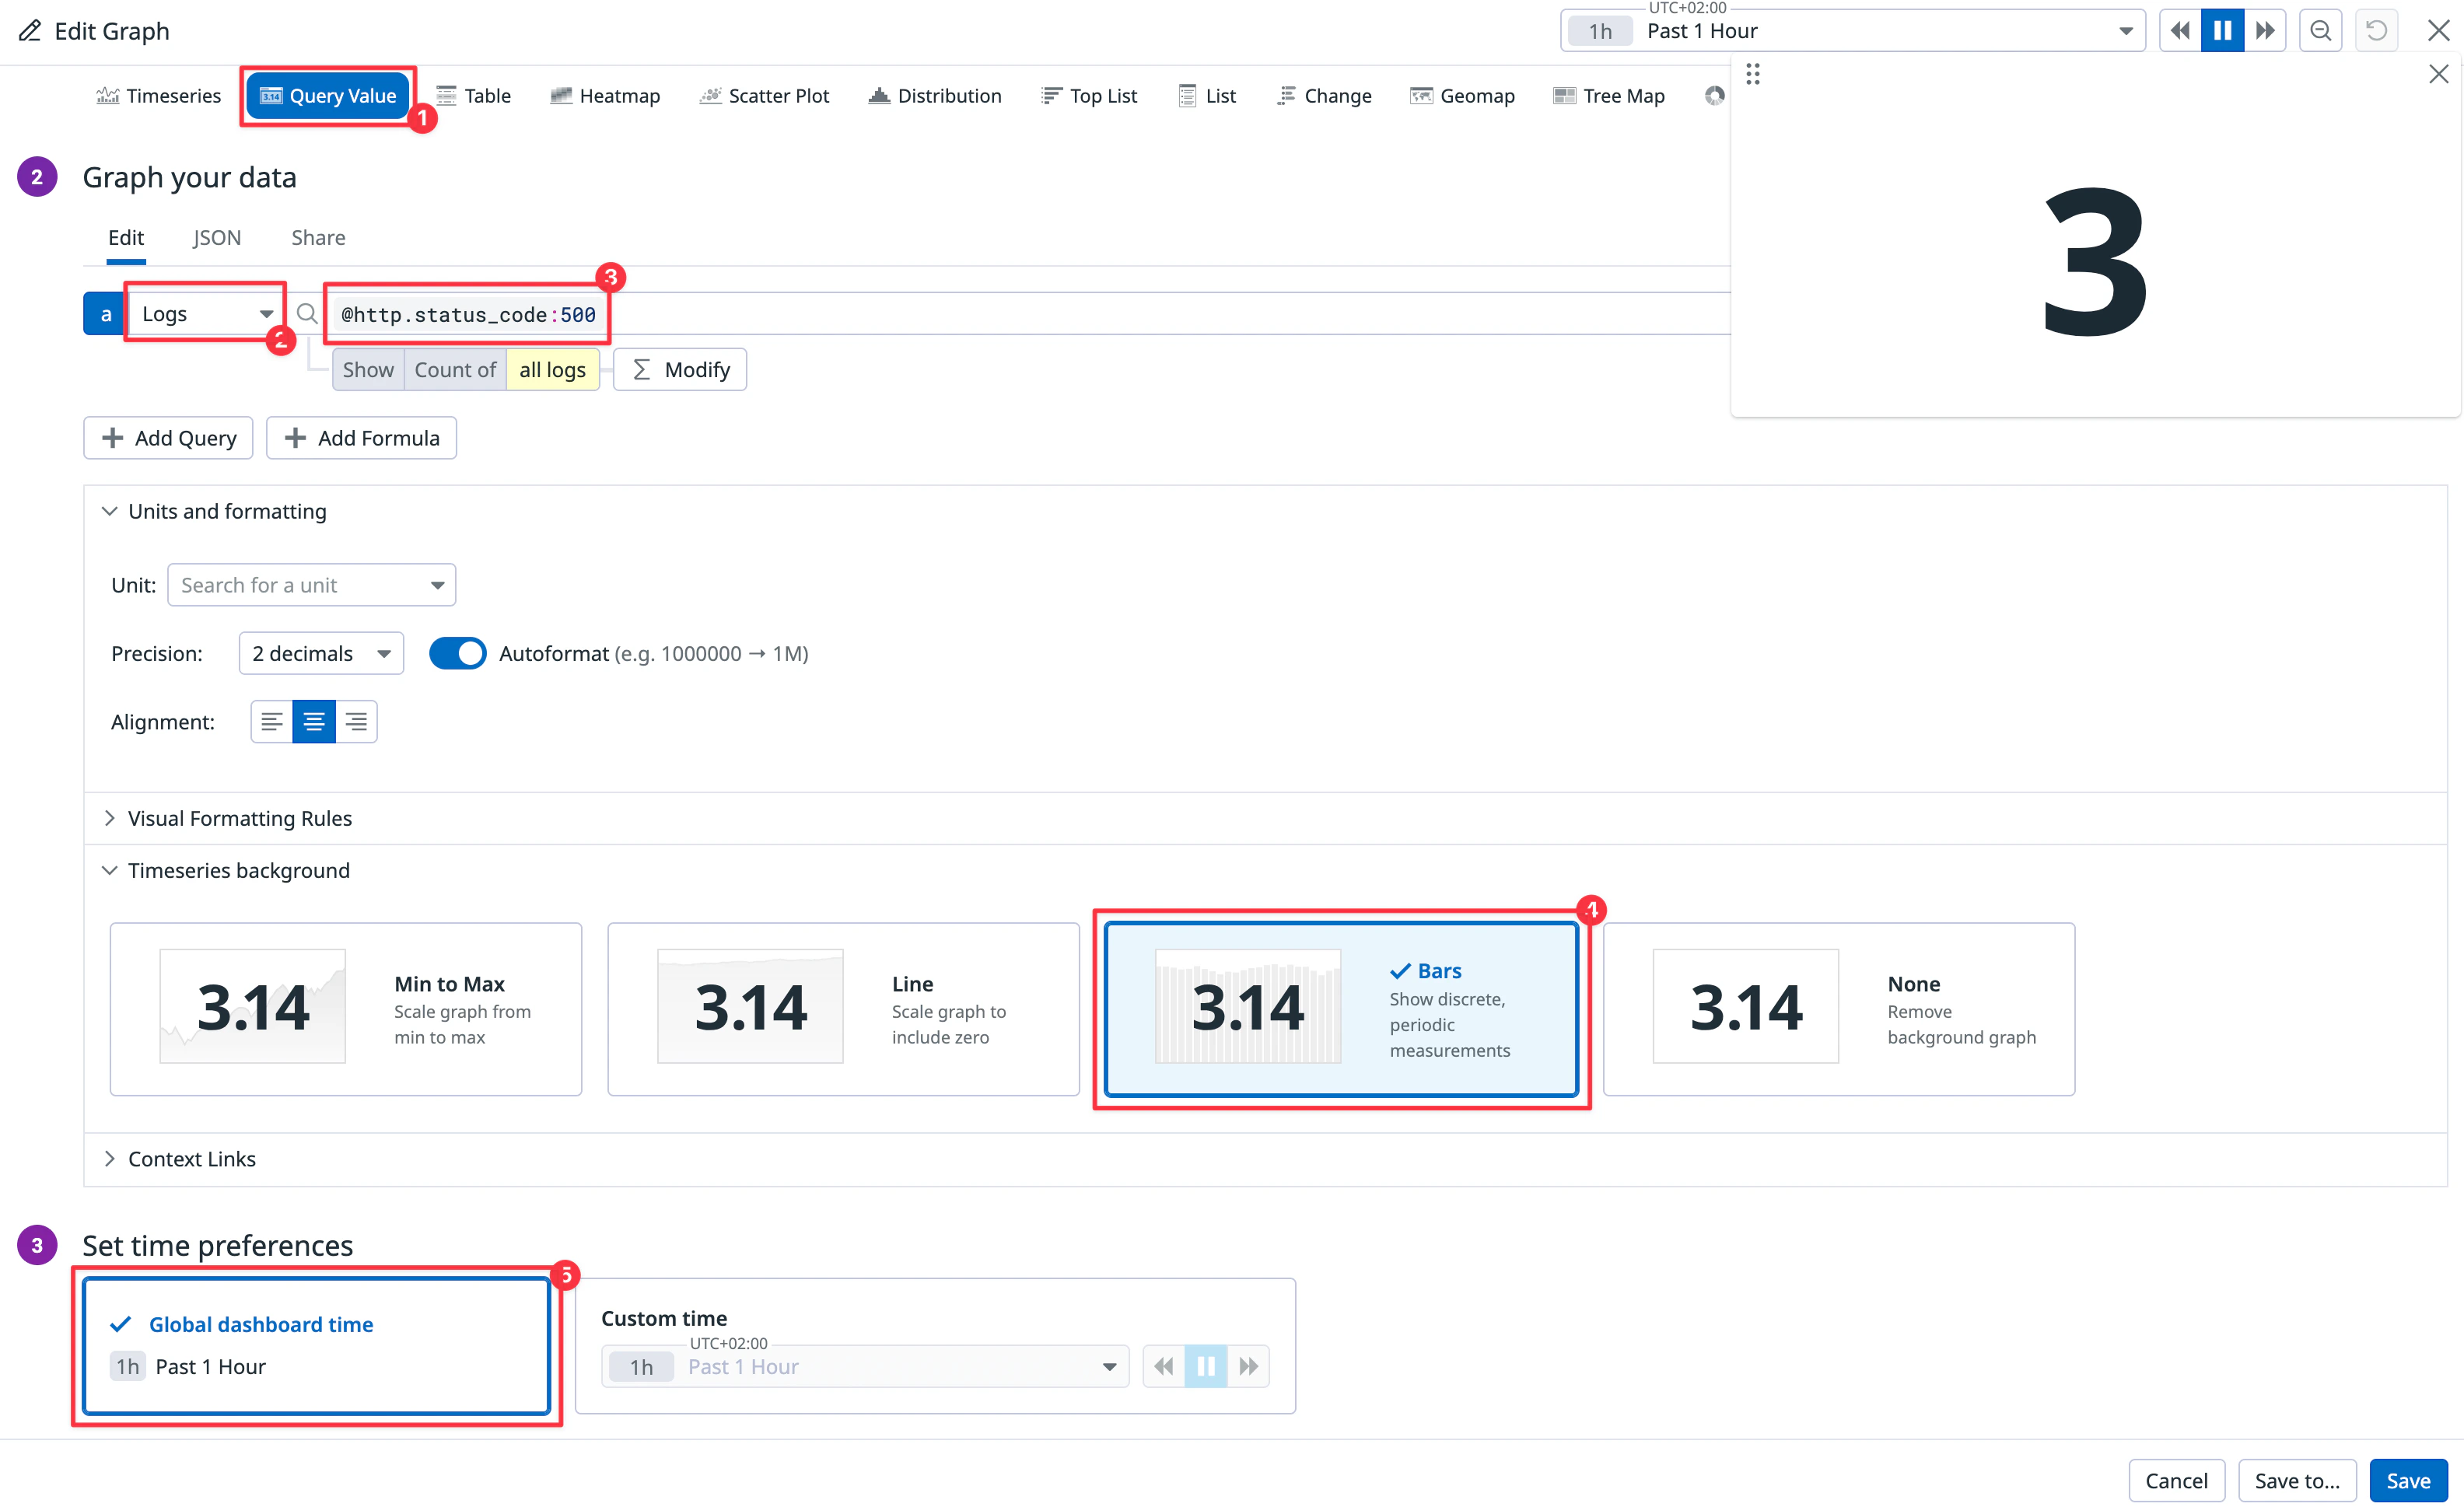
- Choose Query value as your visualization.
-
- Change Metrics to Logs (ngrok does not export metrics) and enter the log filter,
@http.status_code:500, so that Datadog only counts errors.
- Change Metrics to Logs (ngrok does not export metrics) and enter the log filter,
-
- Set the time preference to Past 1 Hour.
-
- Name the widget
Errors in the last hour.
- Name the widget
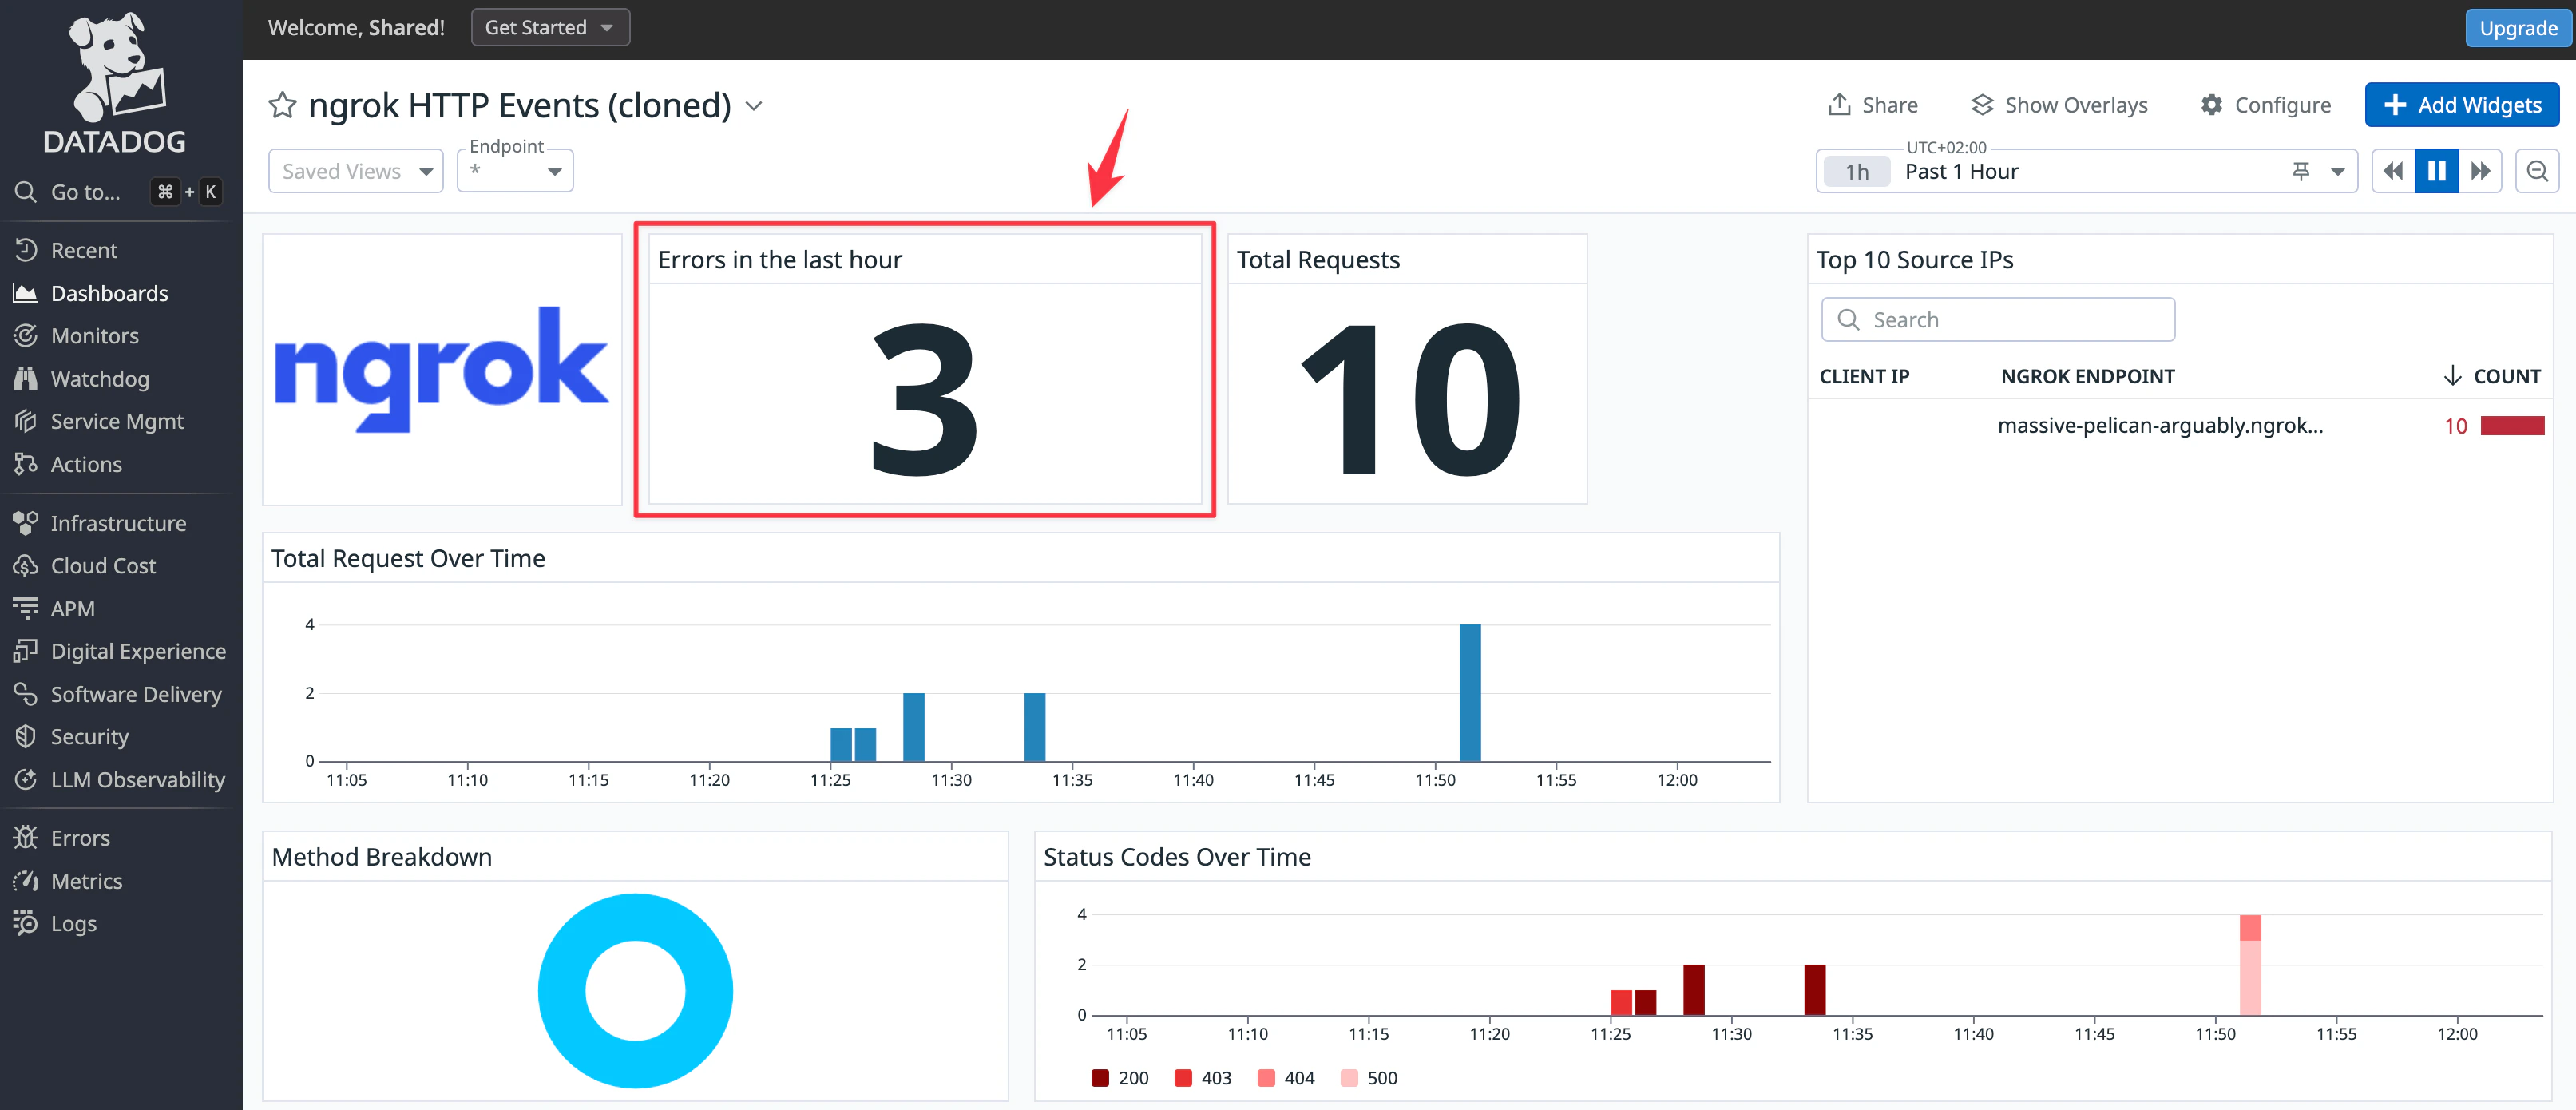
Errors in the last hour widget is to stop the sample API Docker container and then try to browse to the site on the public ngrok endpoint.
If you want to create widgets for other log information, you can see which fields are available by reading the JSON of any event you click in the log inspector.
Create a notification
To complete your monitoring system, you need to set up an alert pushed to your email or mobile app when an error occurs by adding a webhook integration to Datadog. This allows your support team to receive error notifications instead of repeatedly checking the dashboard. You can set up webhooks with the free notification service ntfy.sh as a quick demonstration. For production workloads, consider using email, Slack, mobile push notifications, or incident management tools like PagerDuty.-
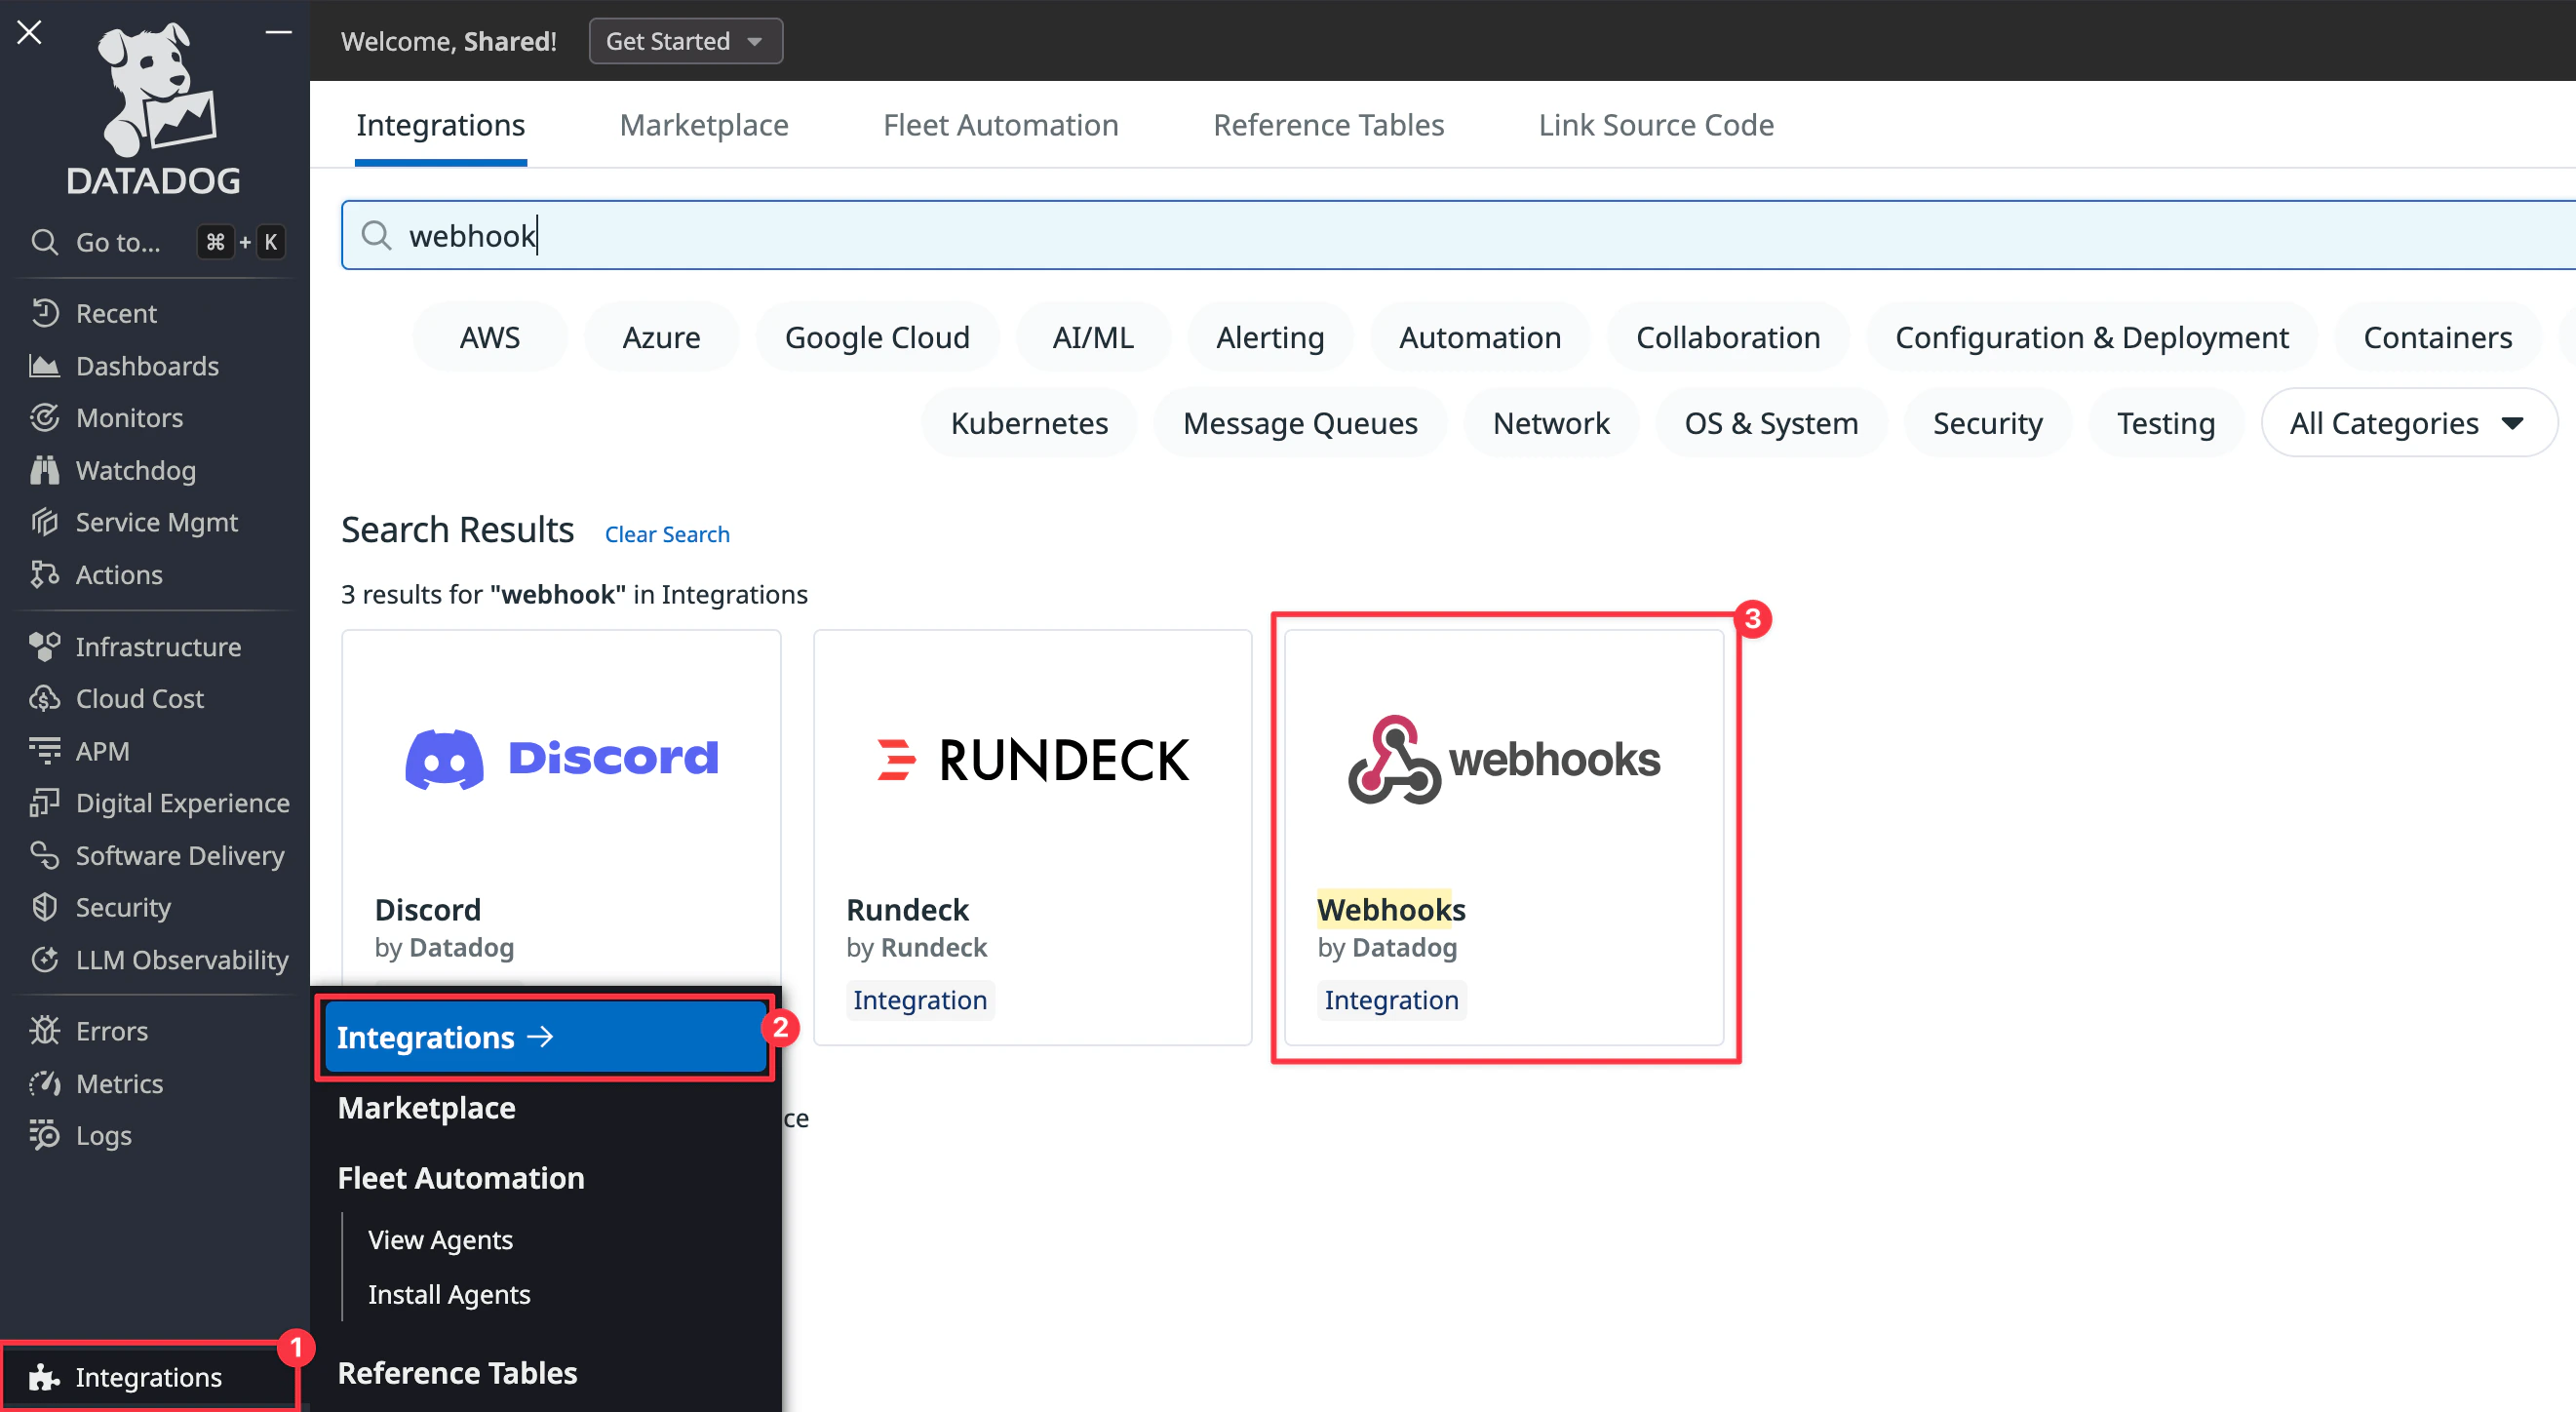
In Datadog, browse to Integrations > Add integration > Webhooks.
-
Under Webhooks, at the bottom of the configuration page, click New.
Set the Name to
ntfy, the URL tohttps://ntfy.sh/$YOUR_COMPANY, and the Payload to Blank. Click Save.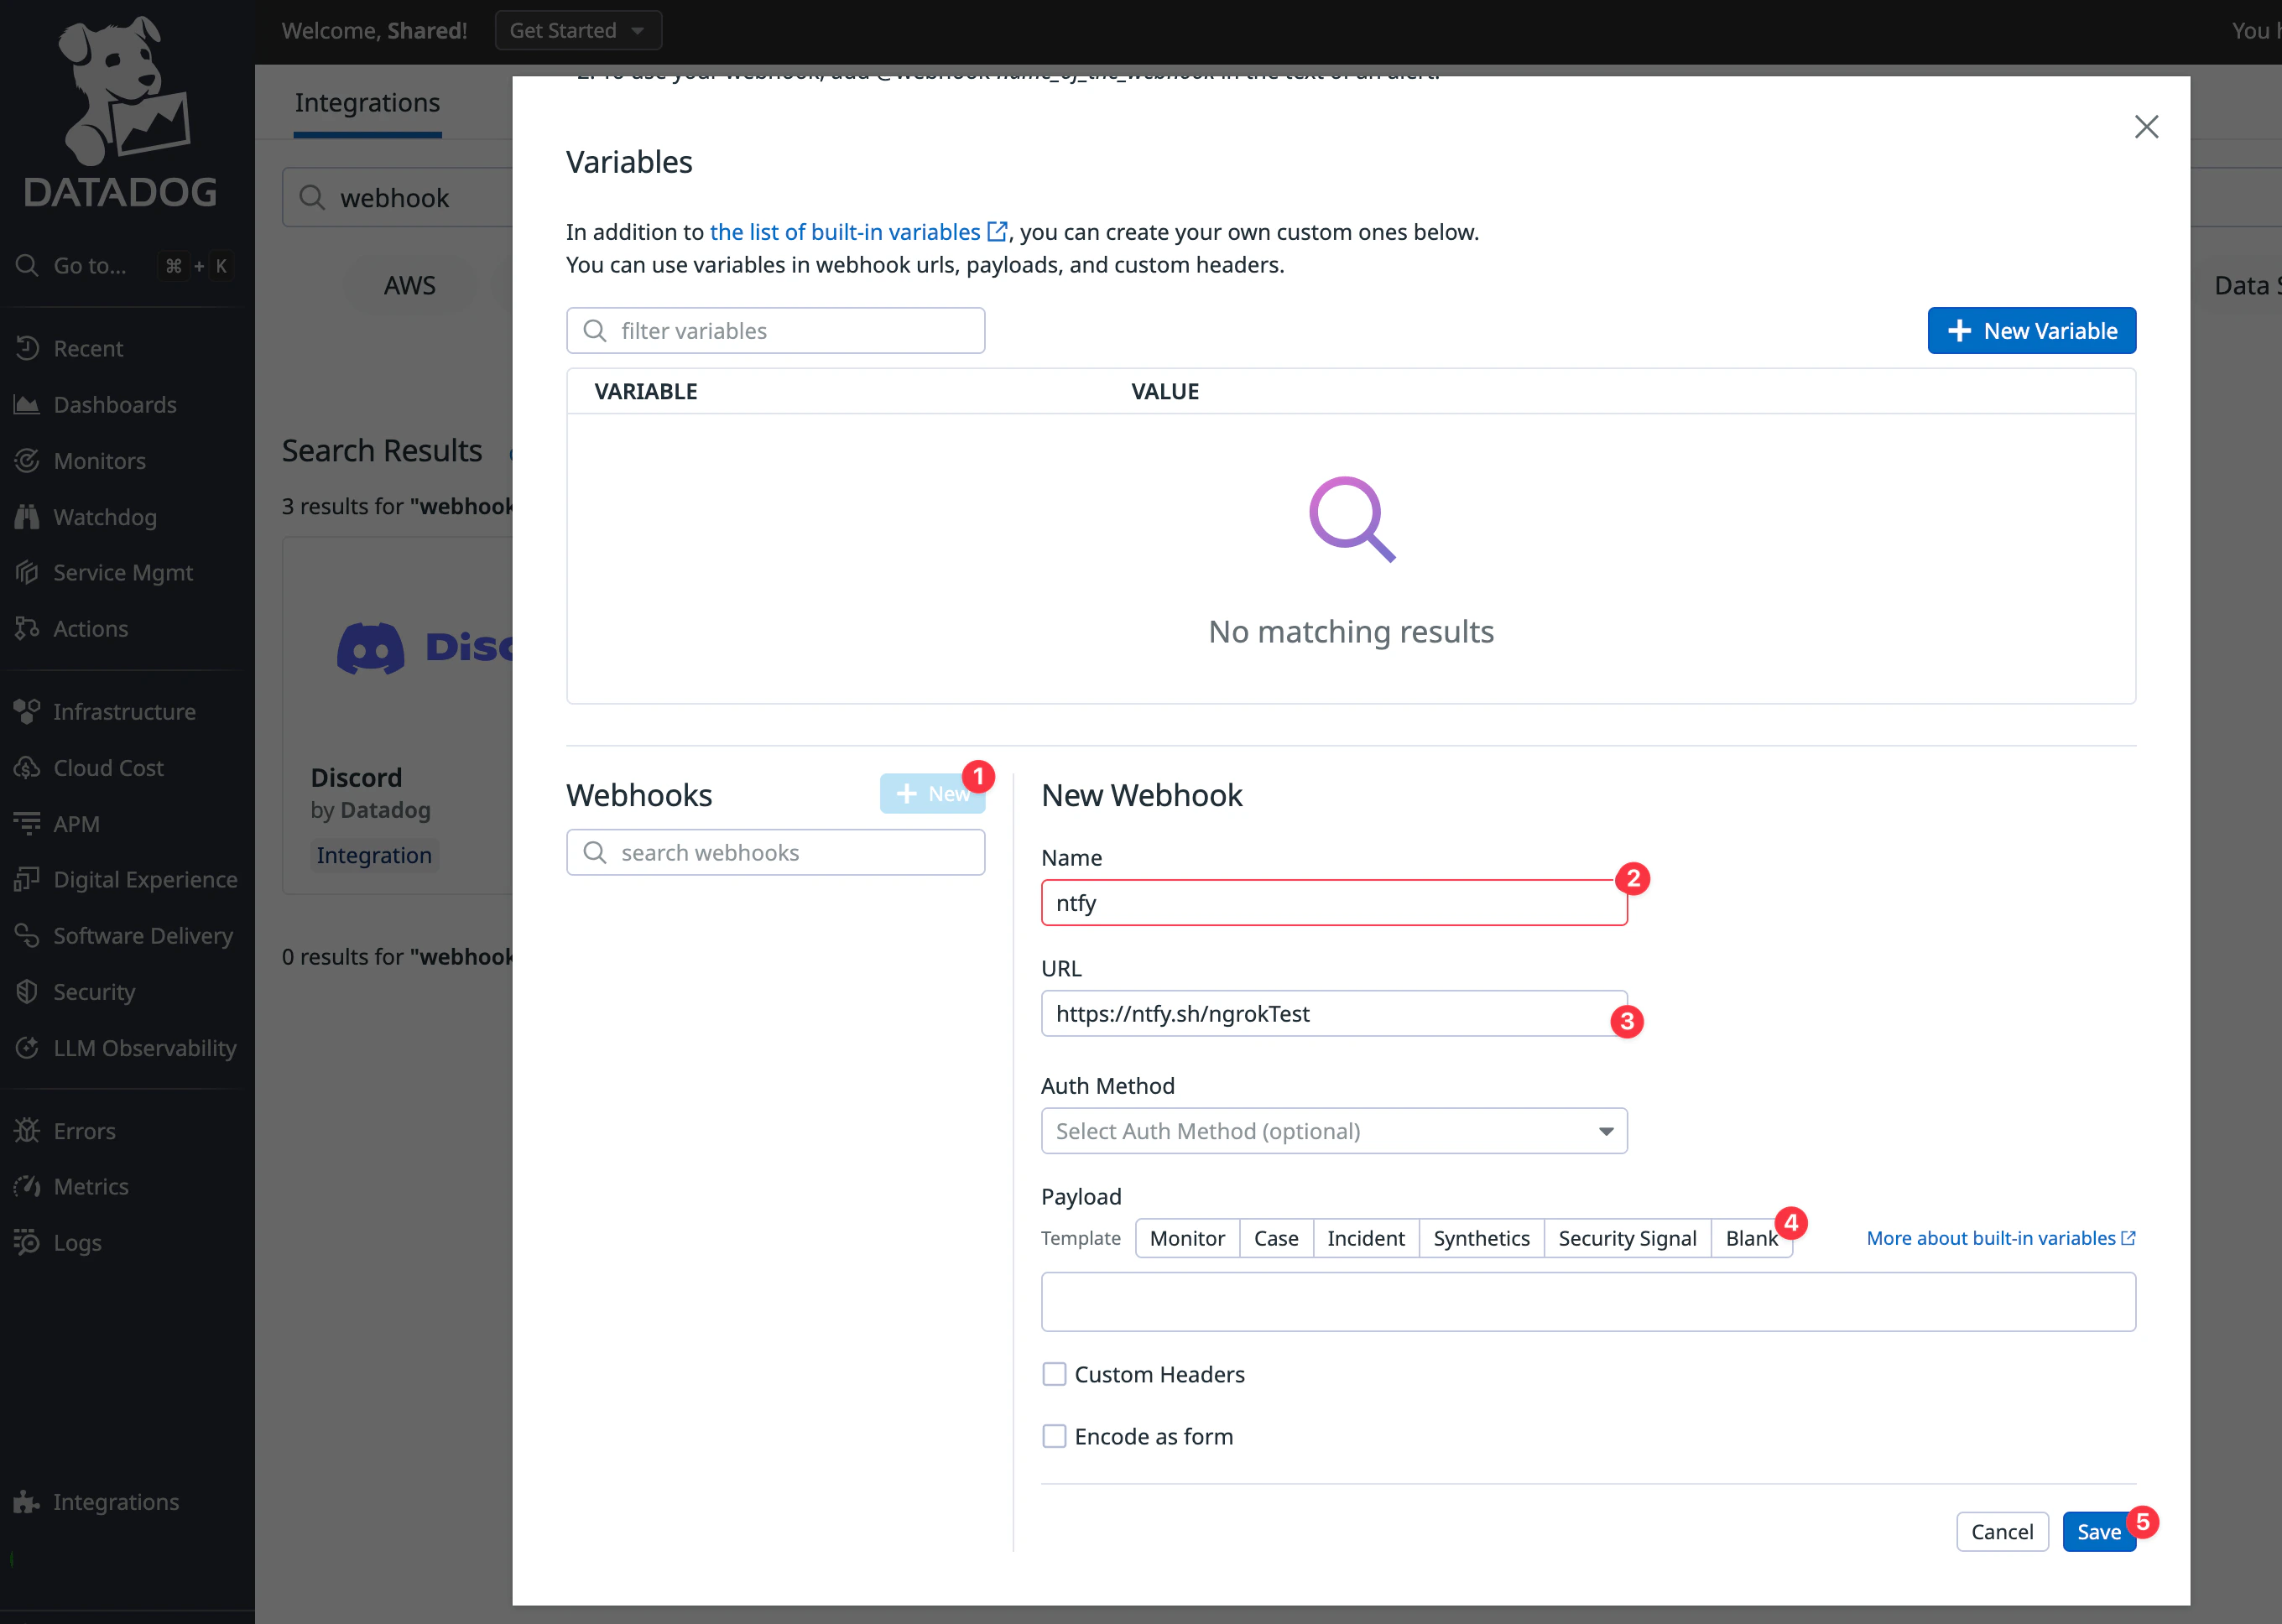
- In the Datadog navigation panel, browse to the Monitors > New monitor. Choose Logs.
-
In the monitor configuration, choose Query for your monitor scope, set the search query to
@http.status_code:500, the time to the last 1 hour, and the notification message: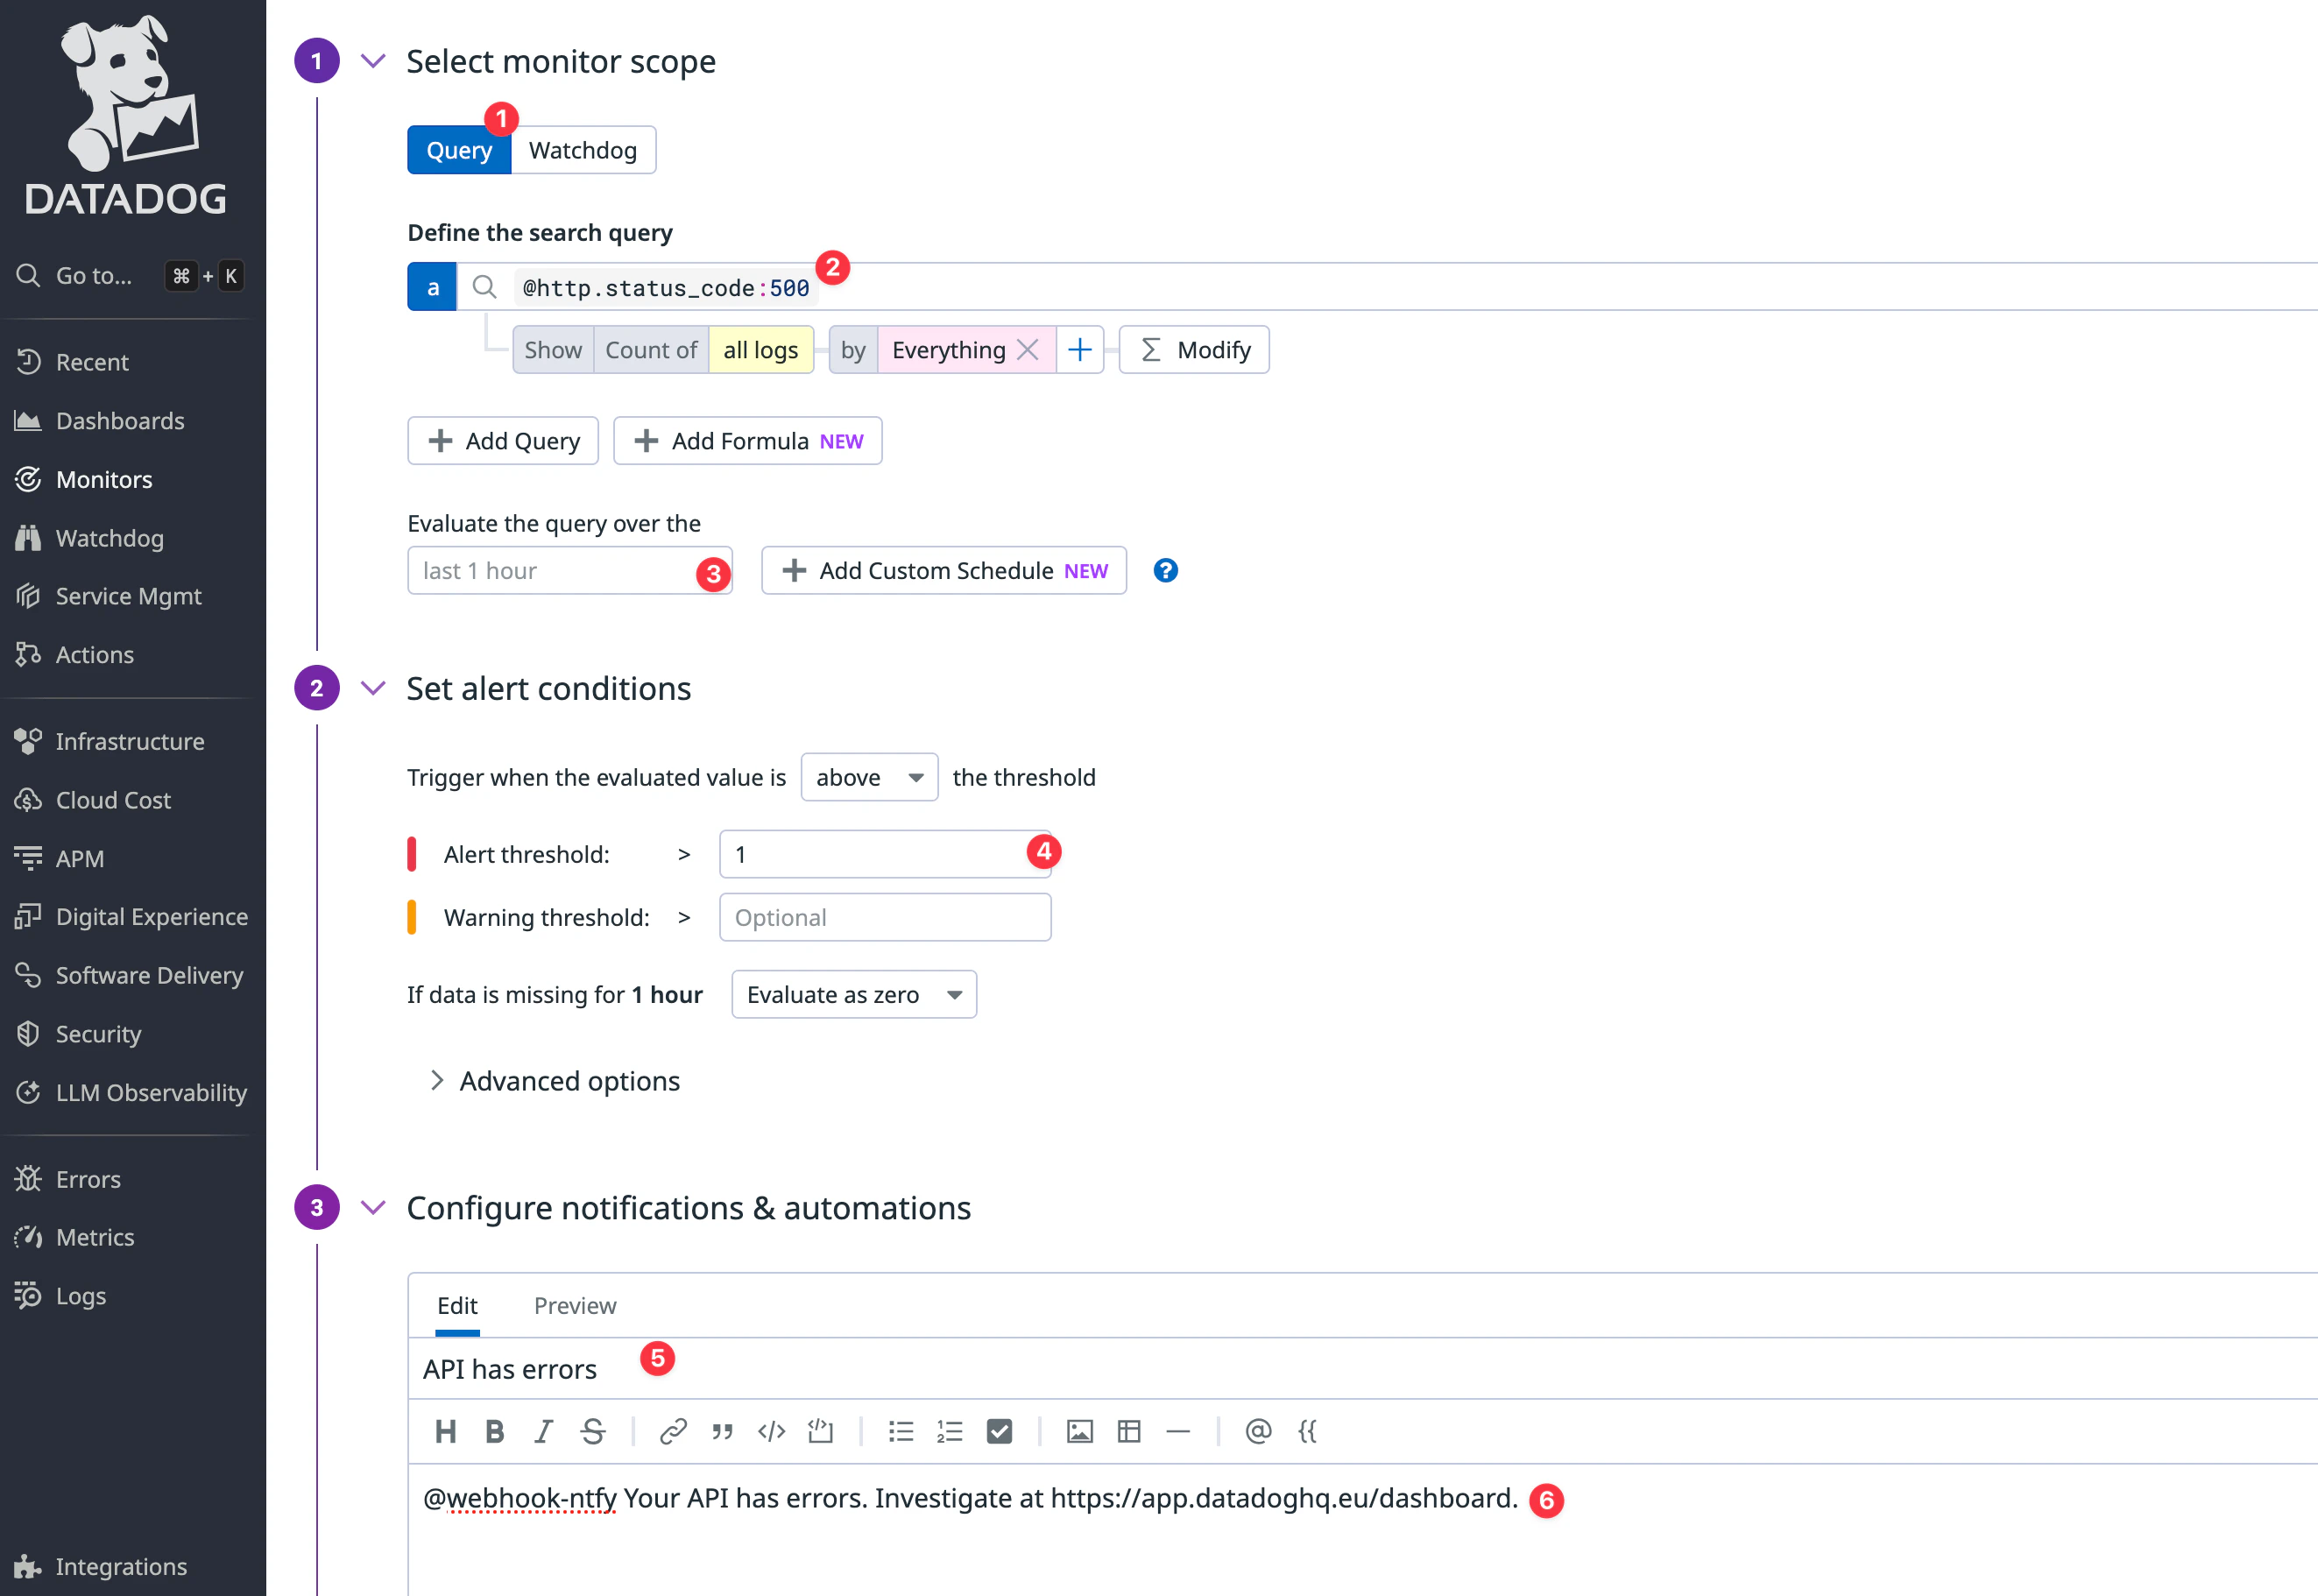
@webhookname matches the webhook integration you created earlier. If the names don’t match, the notification won’t arrive. - Browse to the ngrok test channel on the ntfy website.
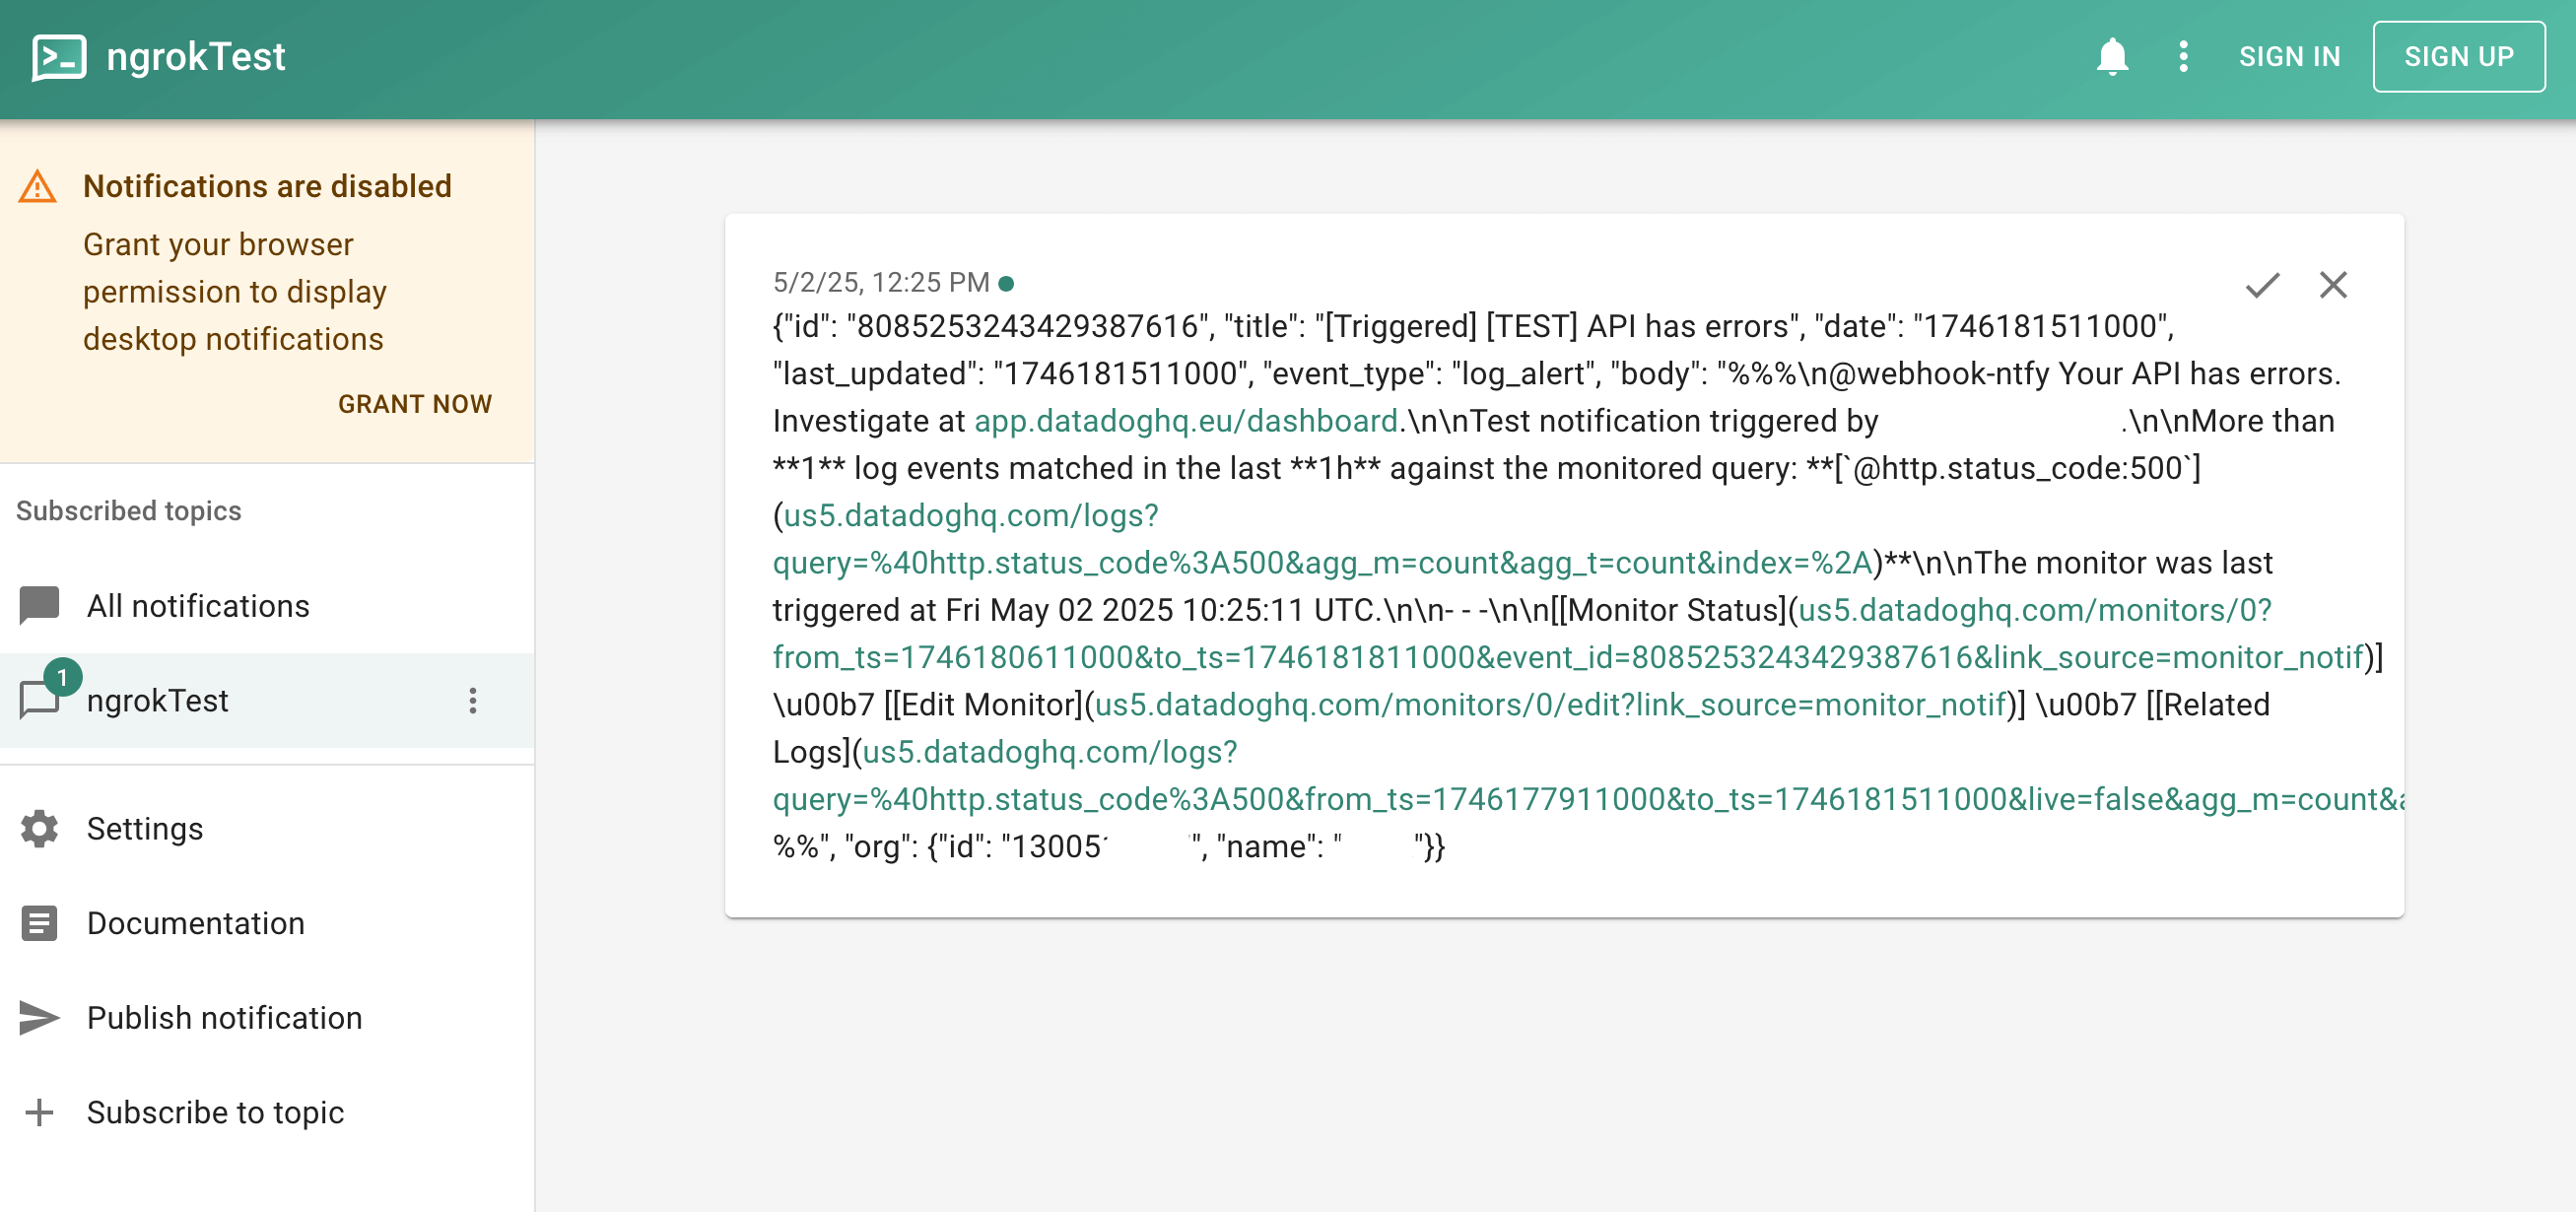
- Click Test notifications at the bottom of the Datadog page and send an alert with Run tests.
-
Notice that the alert appears on the ntfy page.
You can install ntfy as a mobile app so that you are always aware of whether your API has errors.
- Save the monitor. Now, after a delay and once you’ve refreshed the ngrok endpoint for your API, you will receive a notification if an error occurs.
What should you monitor at your API gateway?
Now that you’ve seen how to connect your API traffic to Datadog, explore logs, create a dashboard with custom widgets, and send alerts, consider what exactly you should be monitoring. There are three categories to consider: security, errors, and performance.Security
You need to monitor the security of your infrastructure and any attempts to hack users’ accounts. As mentioned earlier, ngrok emits audit logs for any security changes. You should set up alerts for any changes to API keys, domains, and SSH certificates—anything that indicates attackers might gain access to your infrastructure. Events like stopping and starting agents and endpoints are likely to happen frequently, so they don’t need alerts (especially when running Kubernetes and multiple containers). You still might want to add widgets to monitor these events on a dashboard, however, because surges in activity might indicate problems with your system Additionally, you can add monitors that trigger alerts when activity passes a certain threshold. In terms of user security, you need to monitor anything that indicates attackers might be accessing a user’s account. This includes multiple requests from IP addresses in different countries in a short time span (though this has become common with the increasing use of VPNs), a high rate of failed login attempts, or an anomalous pattern of request access. To make a monitoring rule that recognizes anomalies, you first need to track the average number of requests the average user makes to various endpoints in your API.Errors
Errors are the simplest category to monitor. Generally, if your API returns status codes in the500 range instead of the 200 range, you have some debugging and remediation to attend to.
Using Datadog monitoring, create an alert to send notifications to ntfy or Slack for all errors.
If a 500 error occurs, use the ngrok replay function to see whether it can be reproduced on a QA server, and send the bug to your developers to fix it.